The existing web portal design was gradually becoming outdated and was also suffering from regular patchwork that required regular updates to the design library. It was in need of a full update to be able to scale better and a look and feel that users could better relate to.
Out-of-Date
The look and feel needed to be acceptable to both older and younger users.
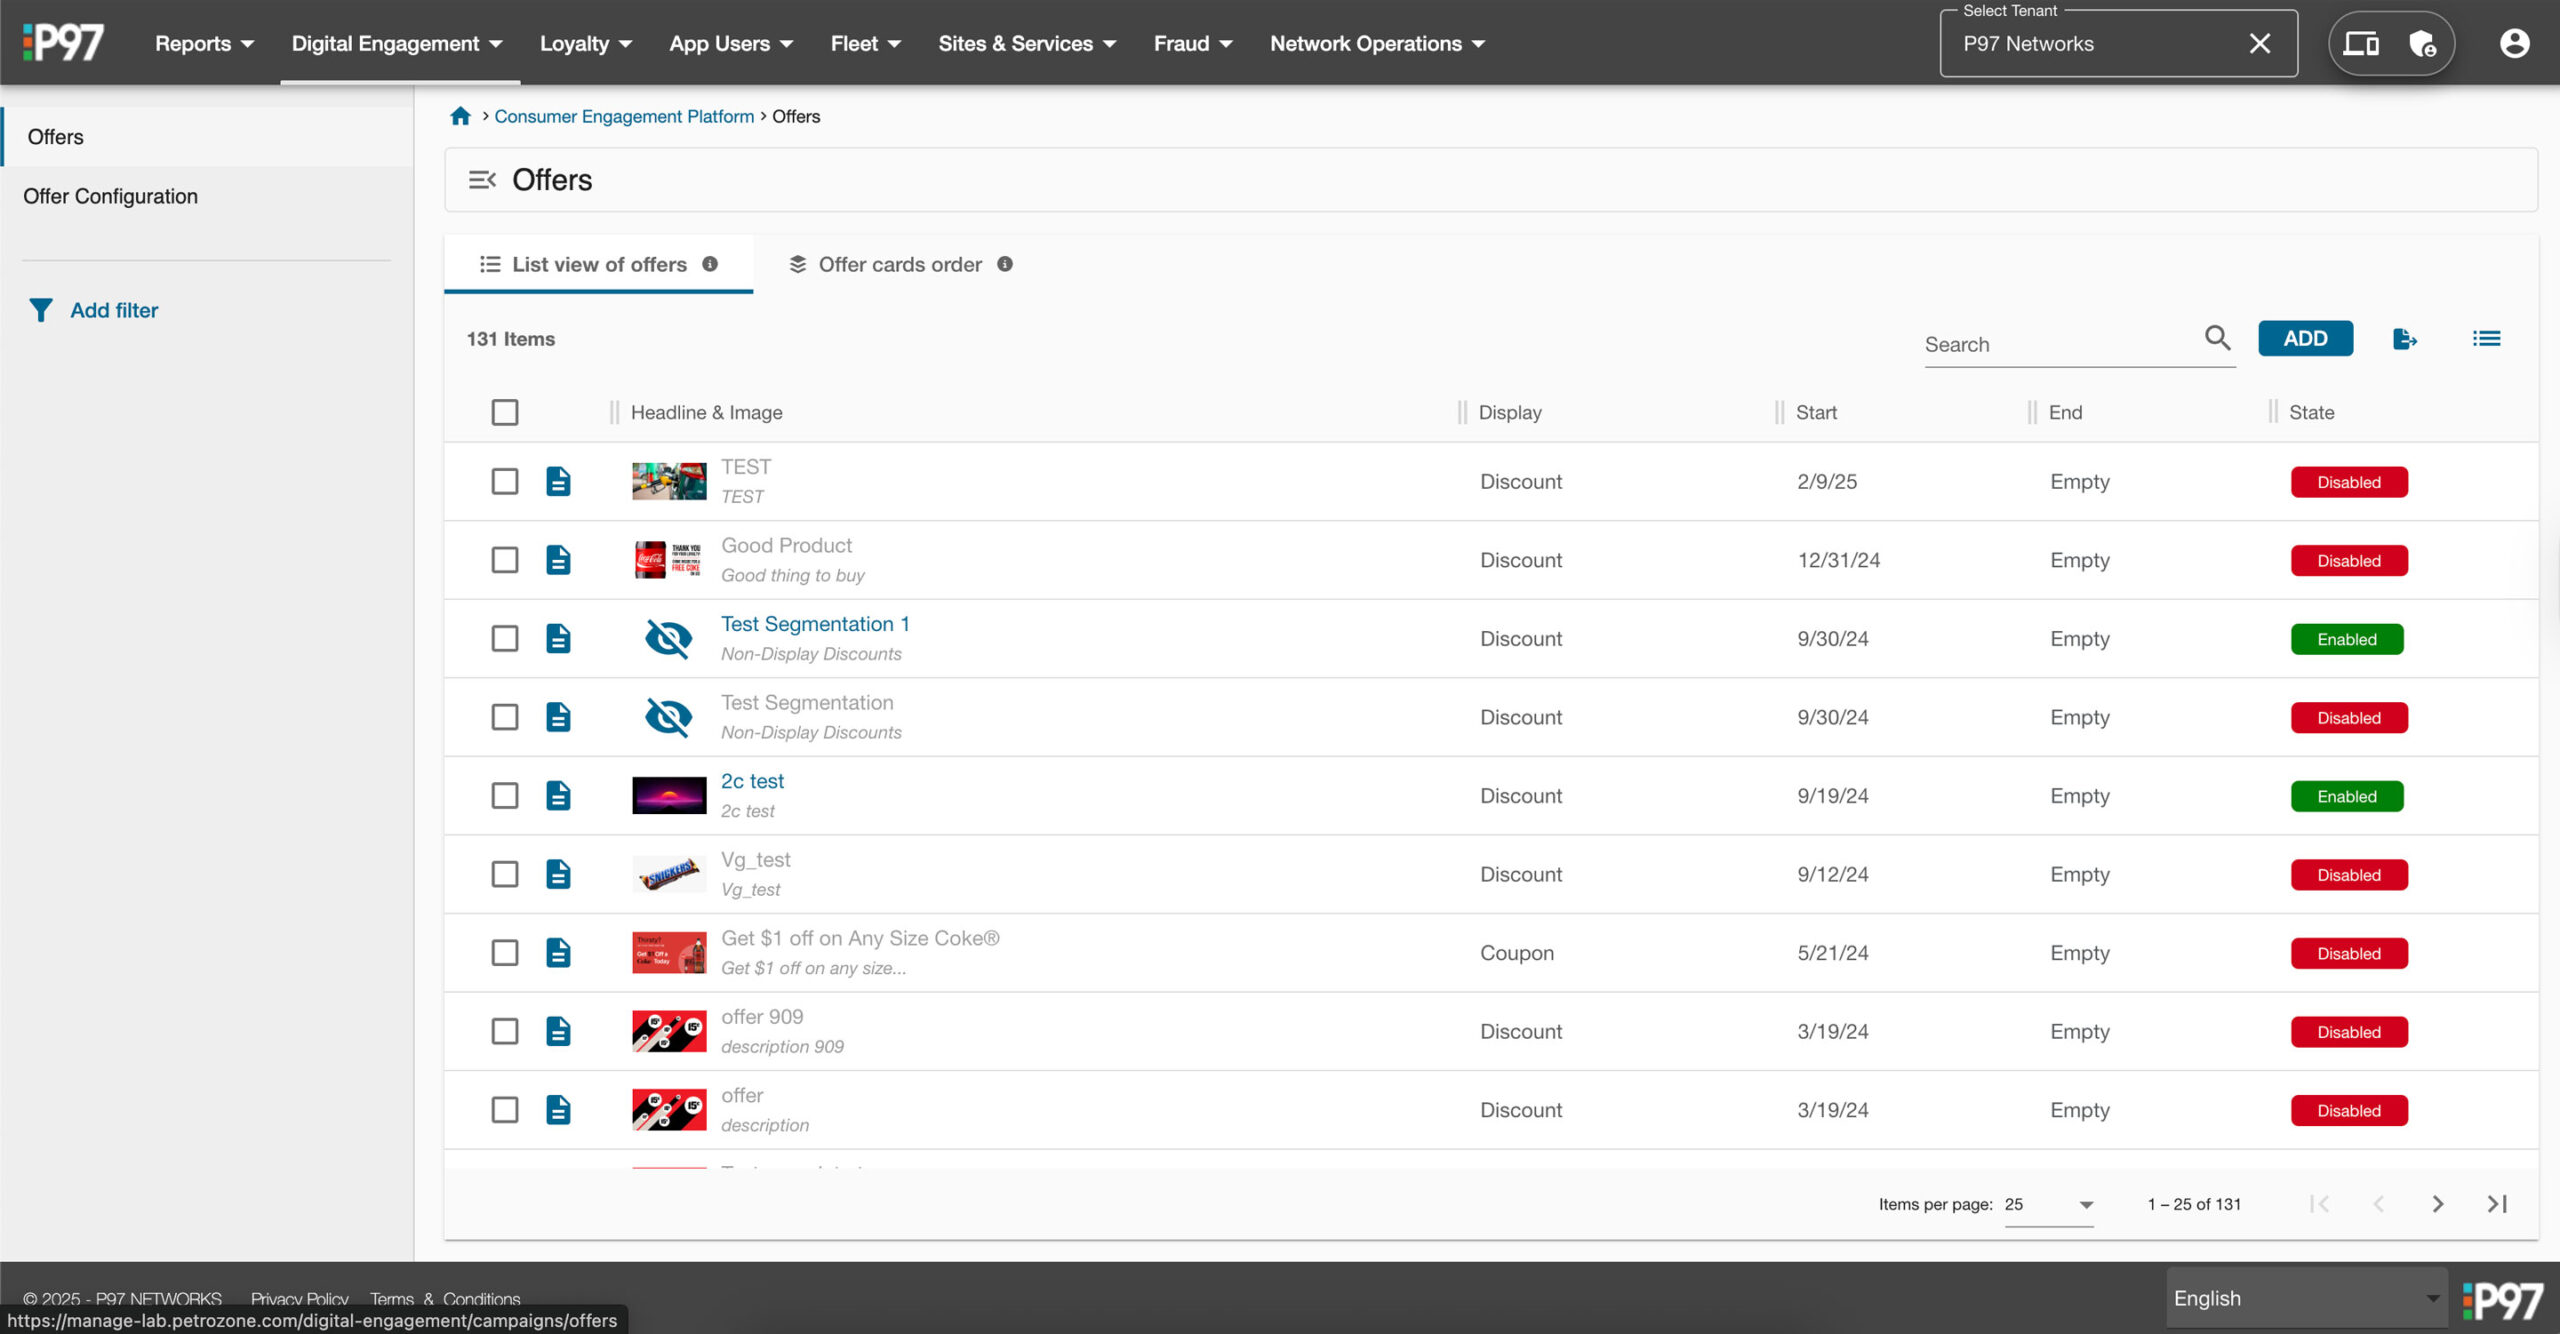
Inconsistent
Elements and components are inconsistent in look and behavior throughout UI.
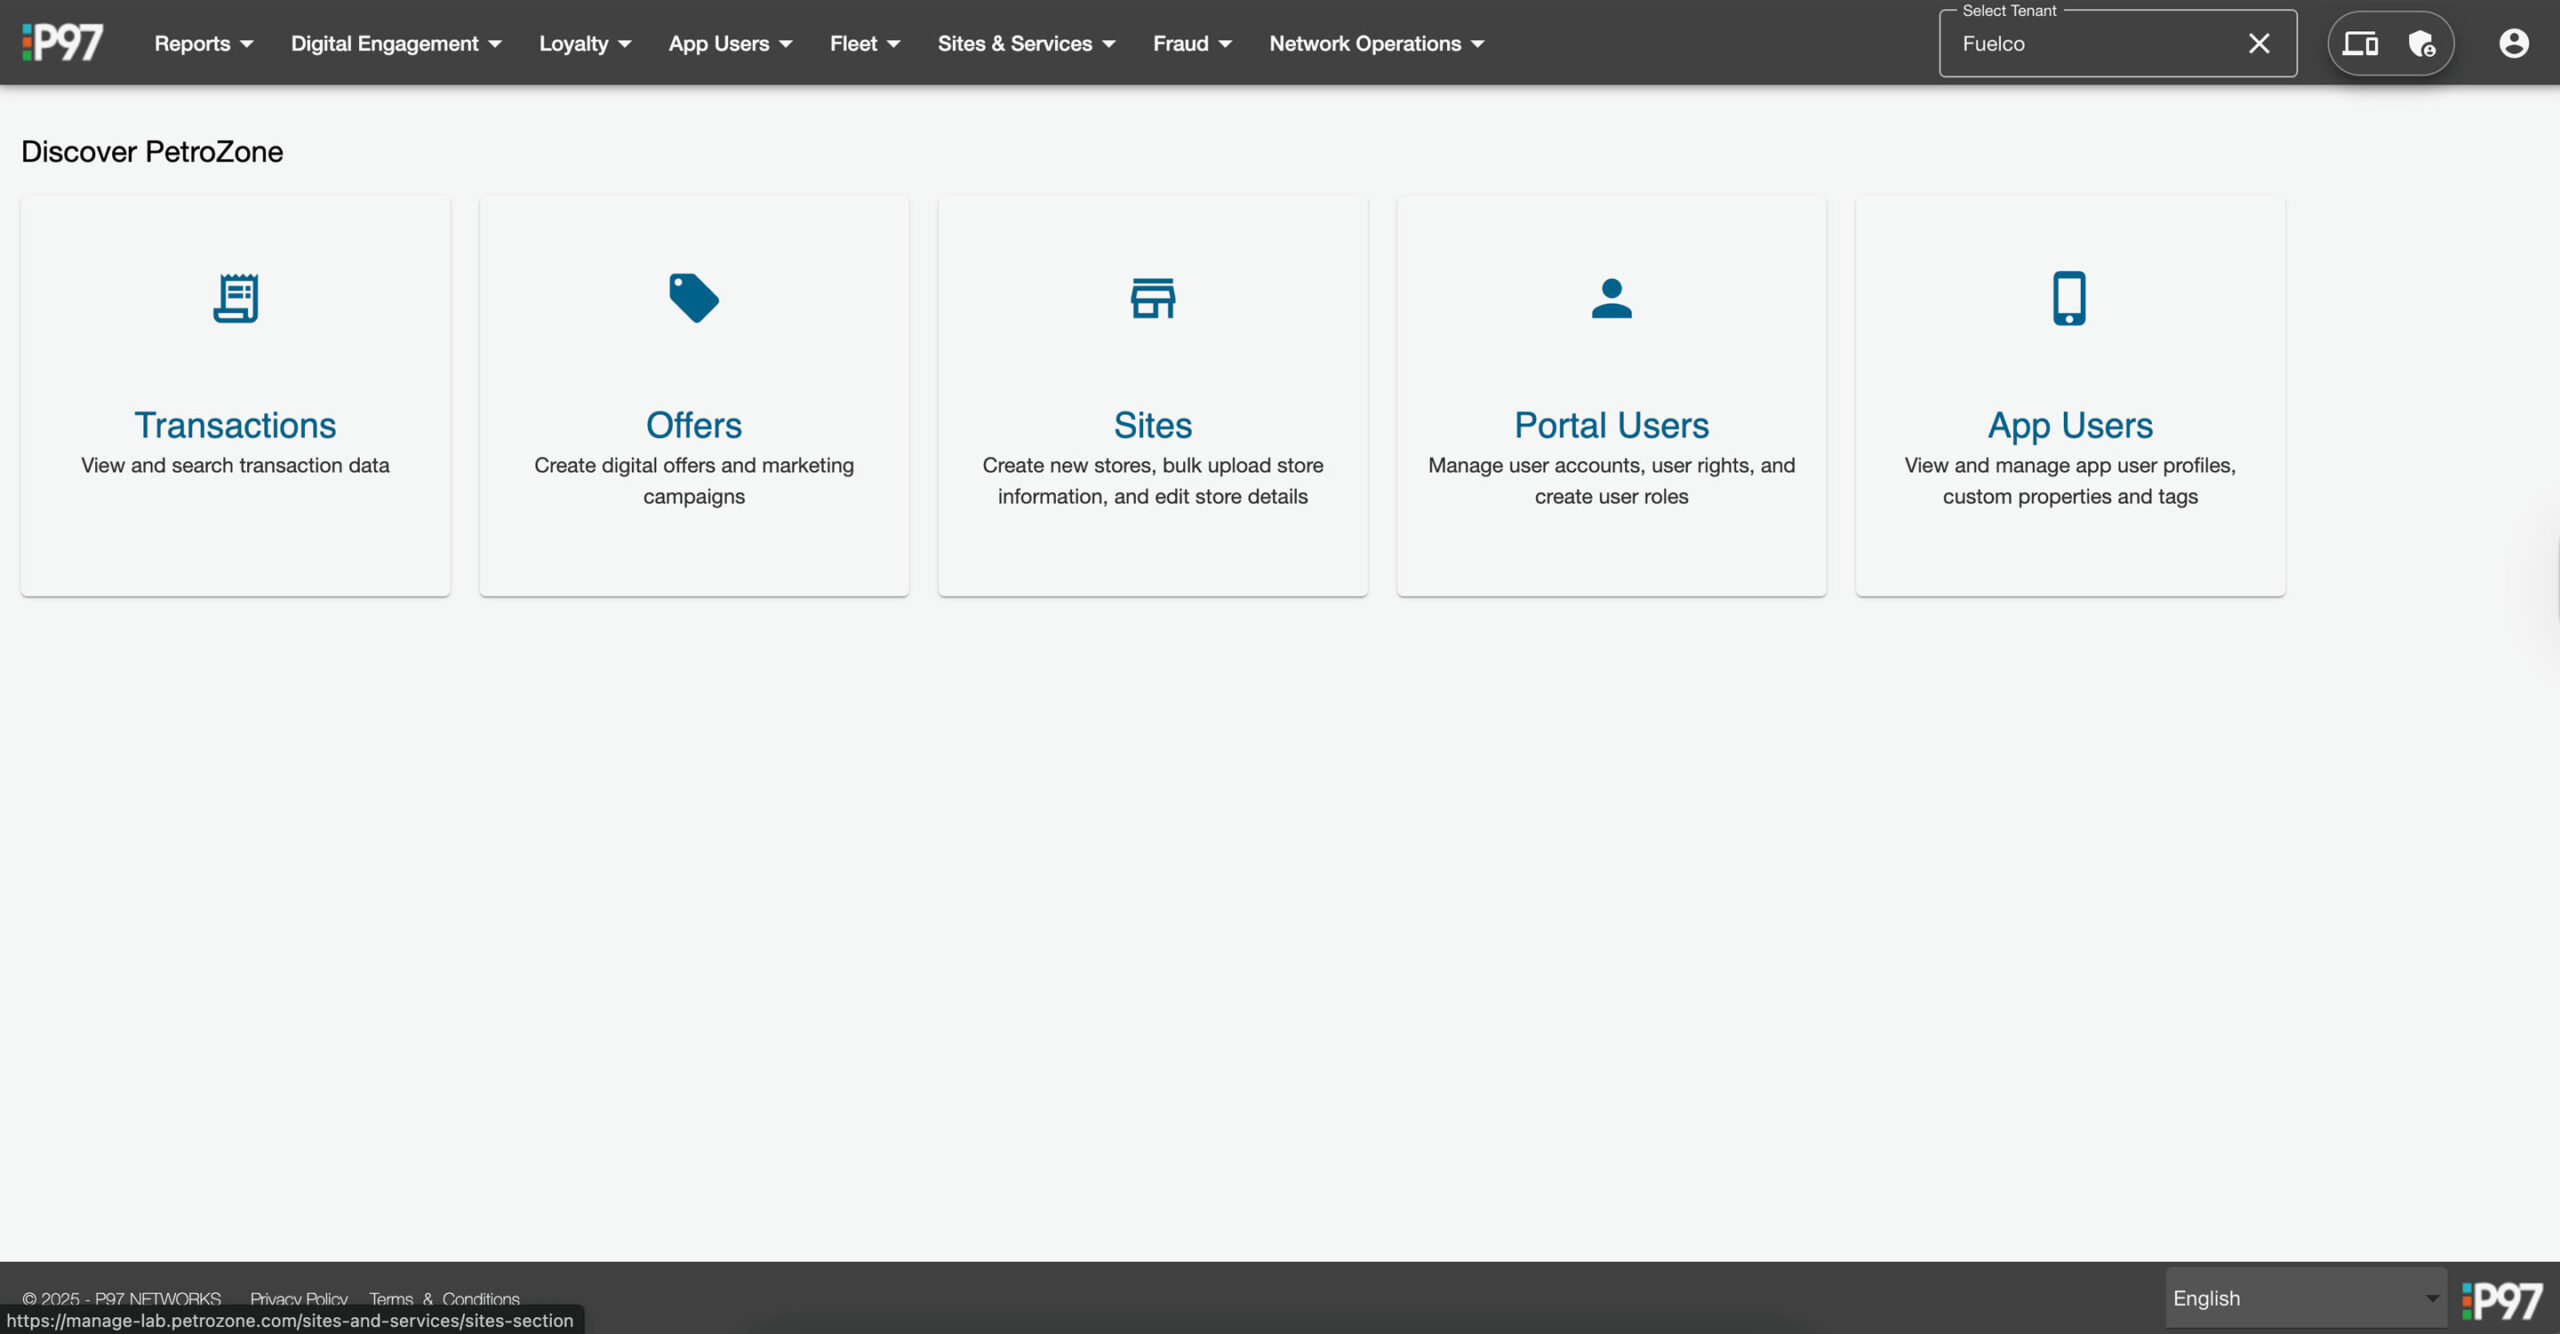
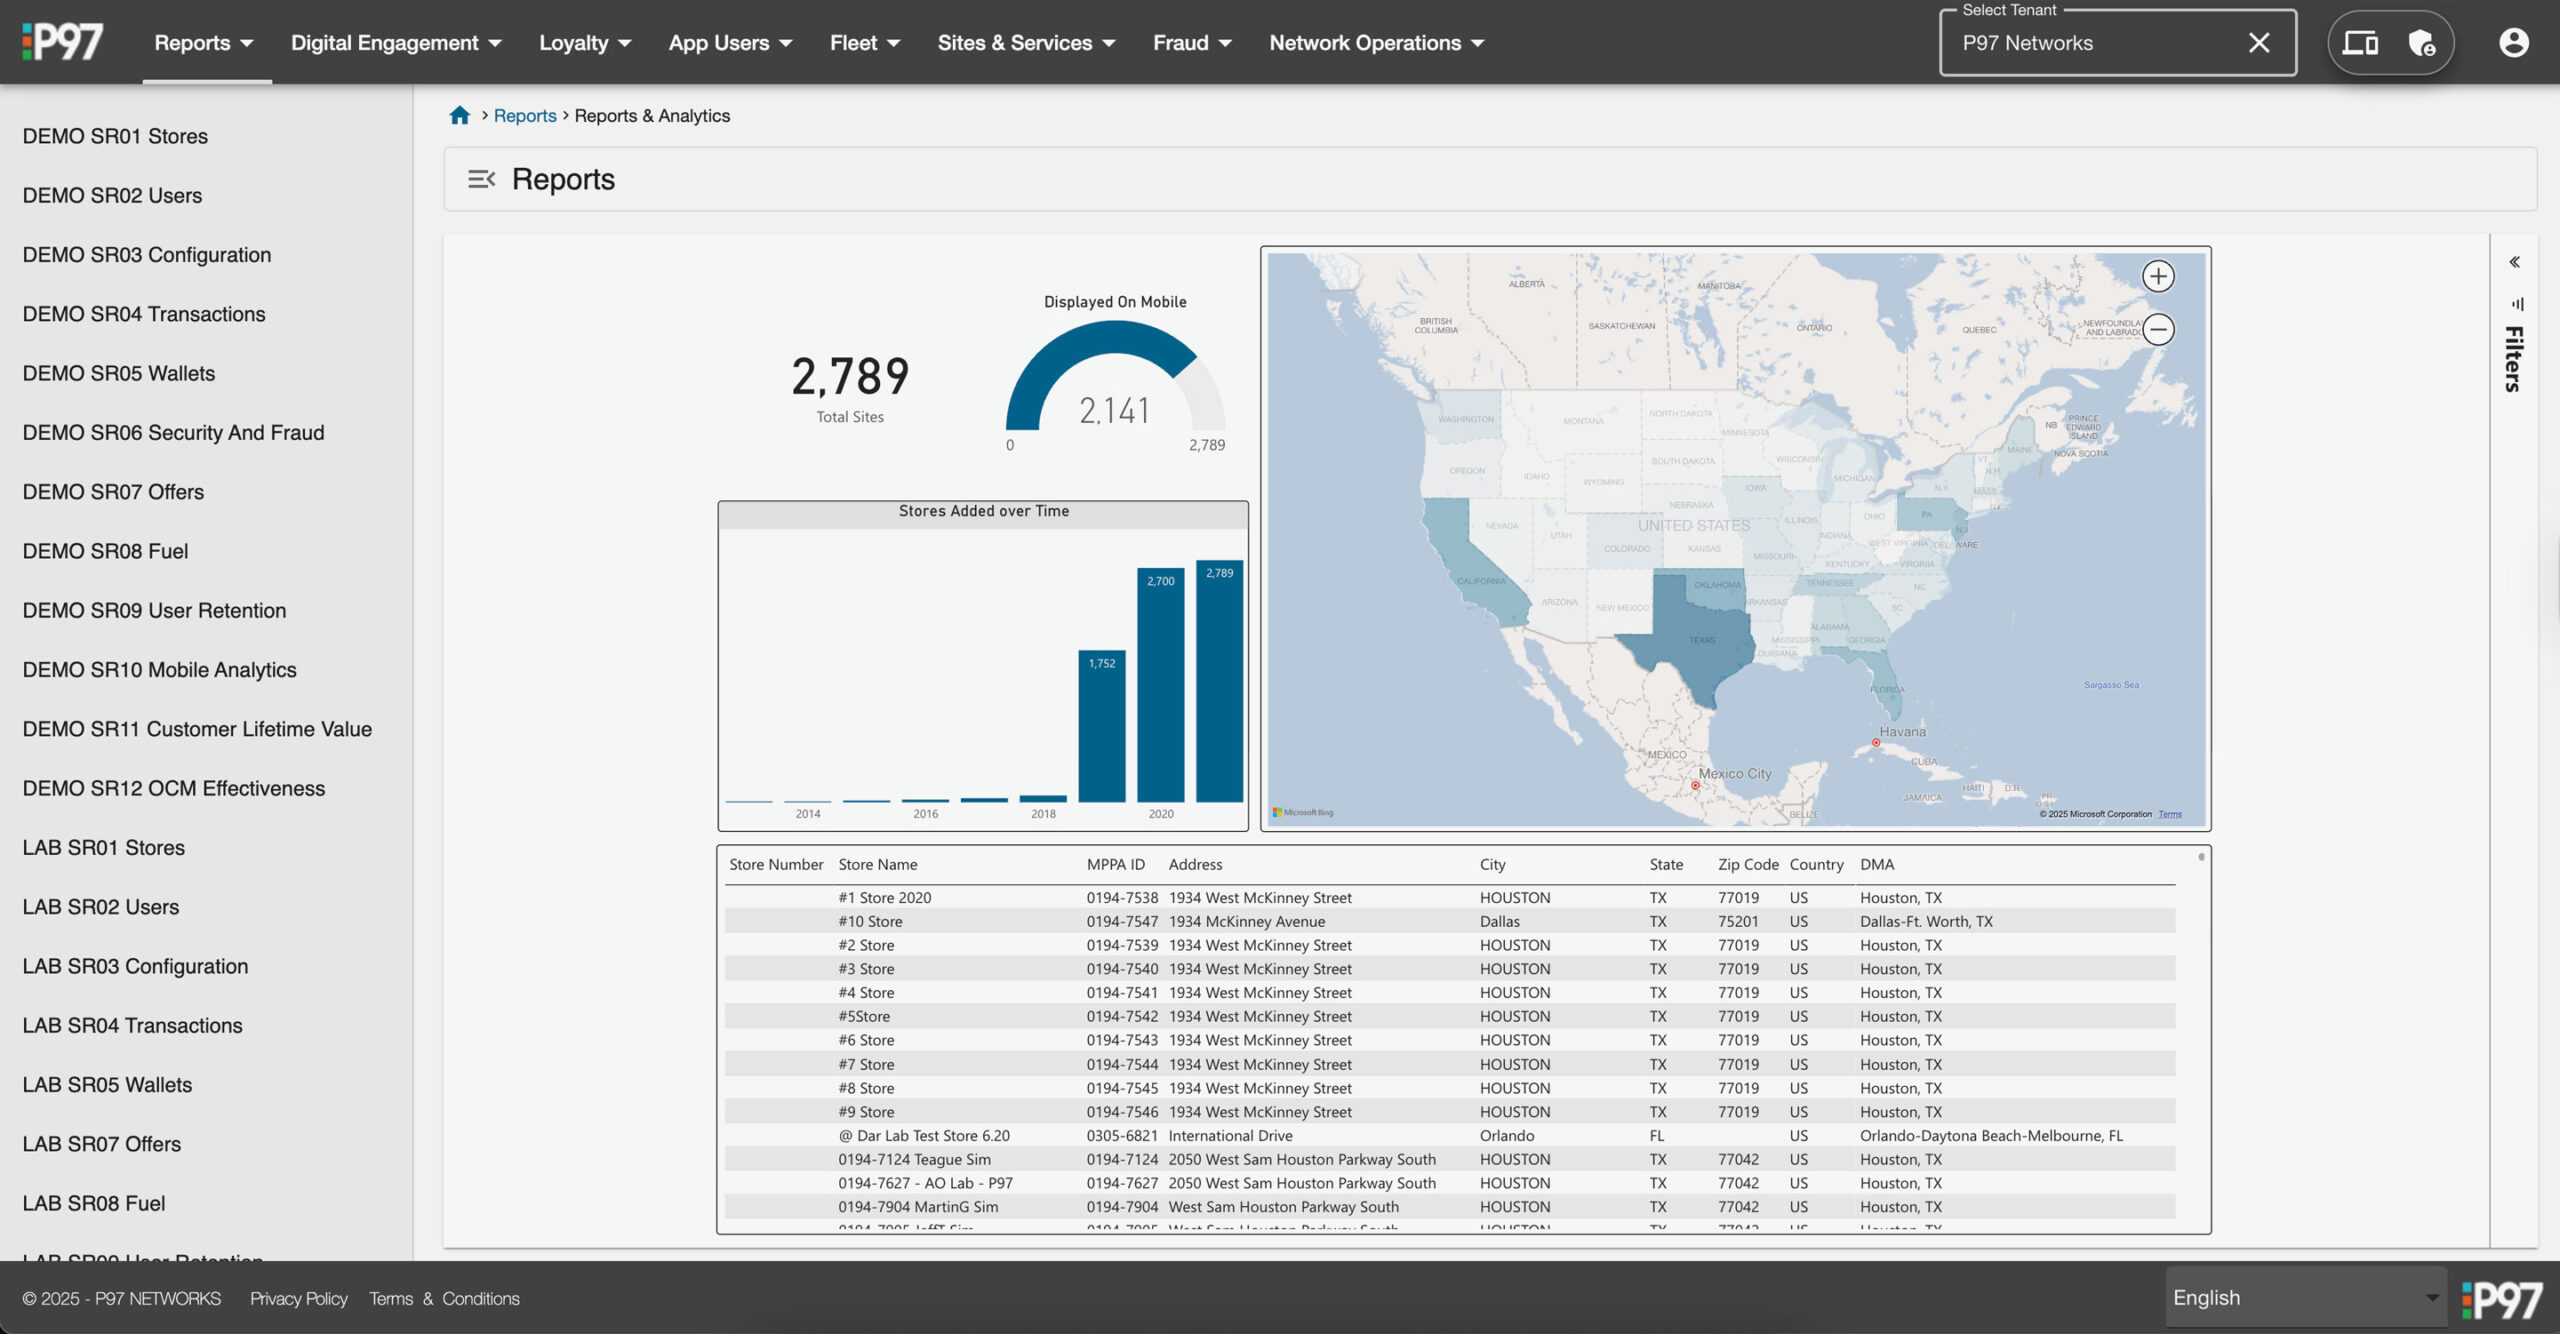
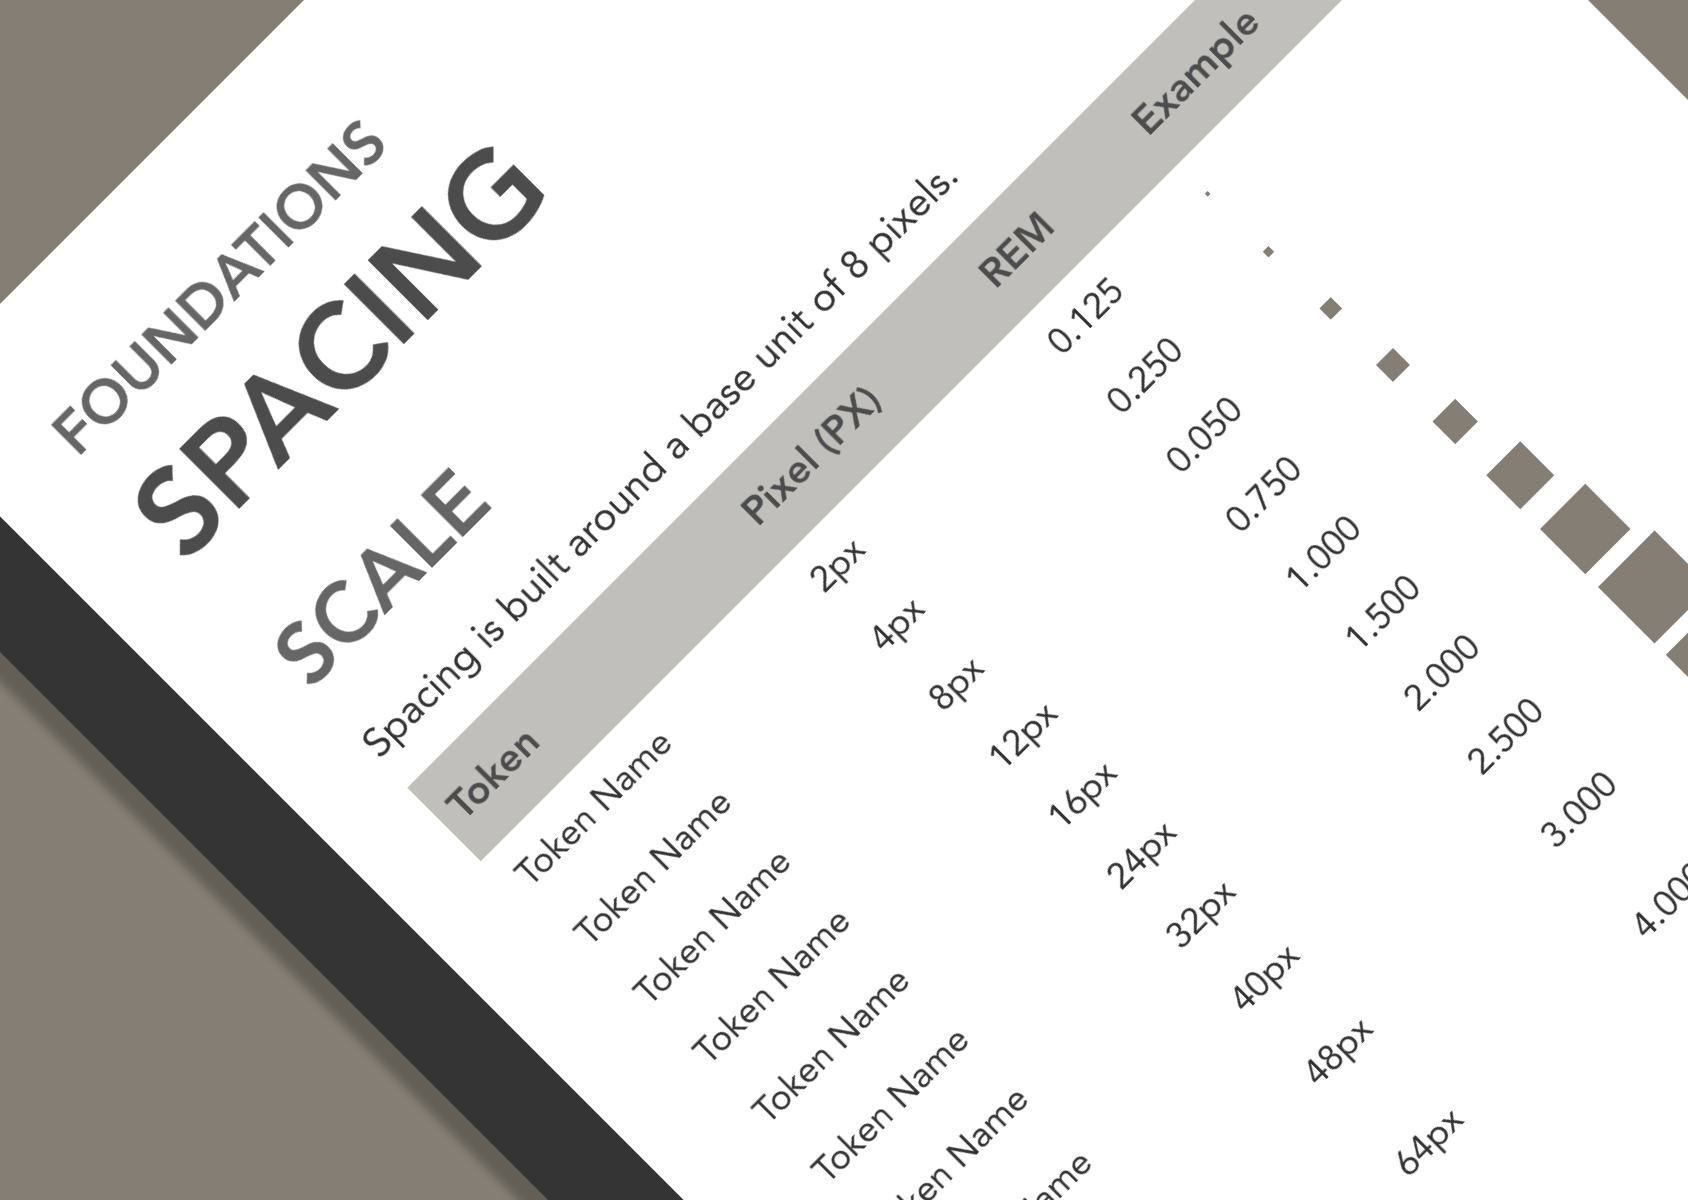
Data-heavy
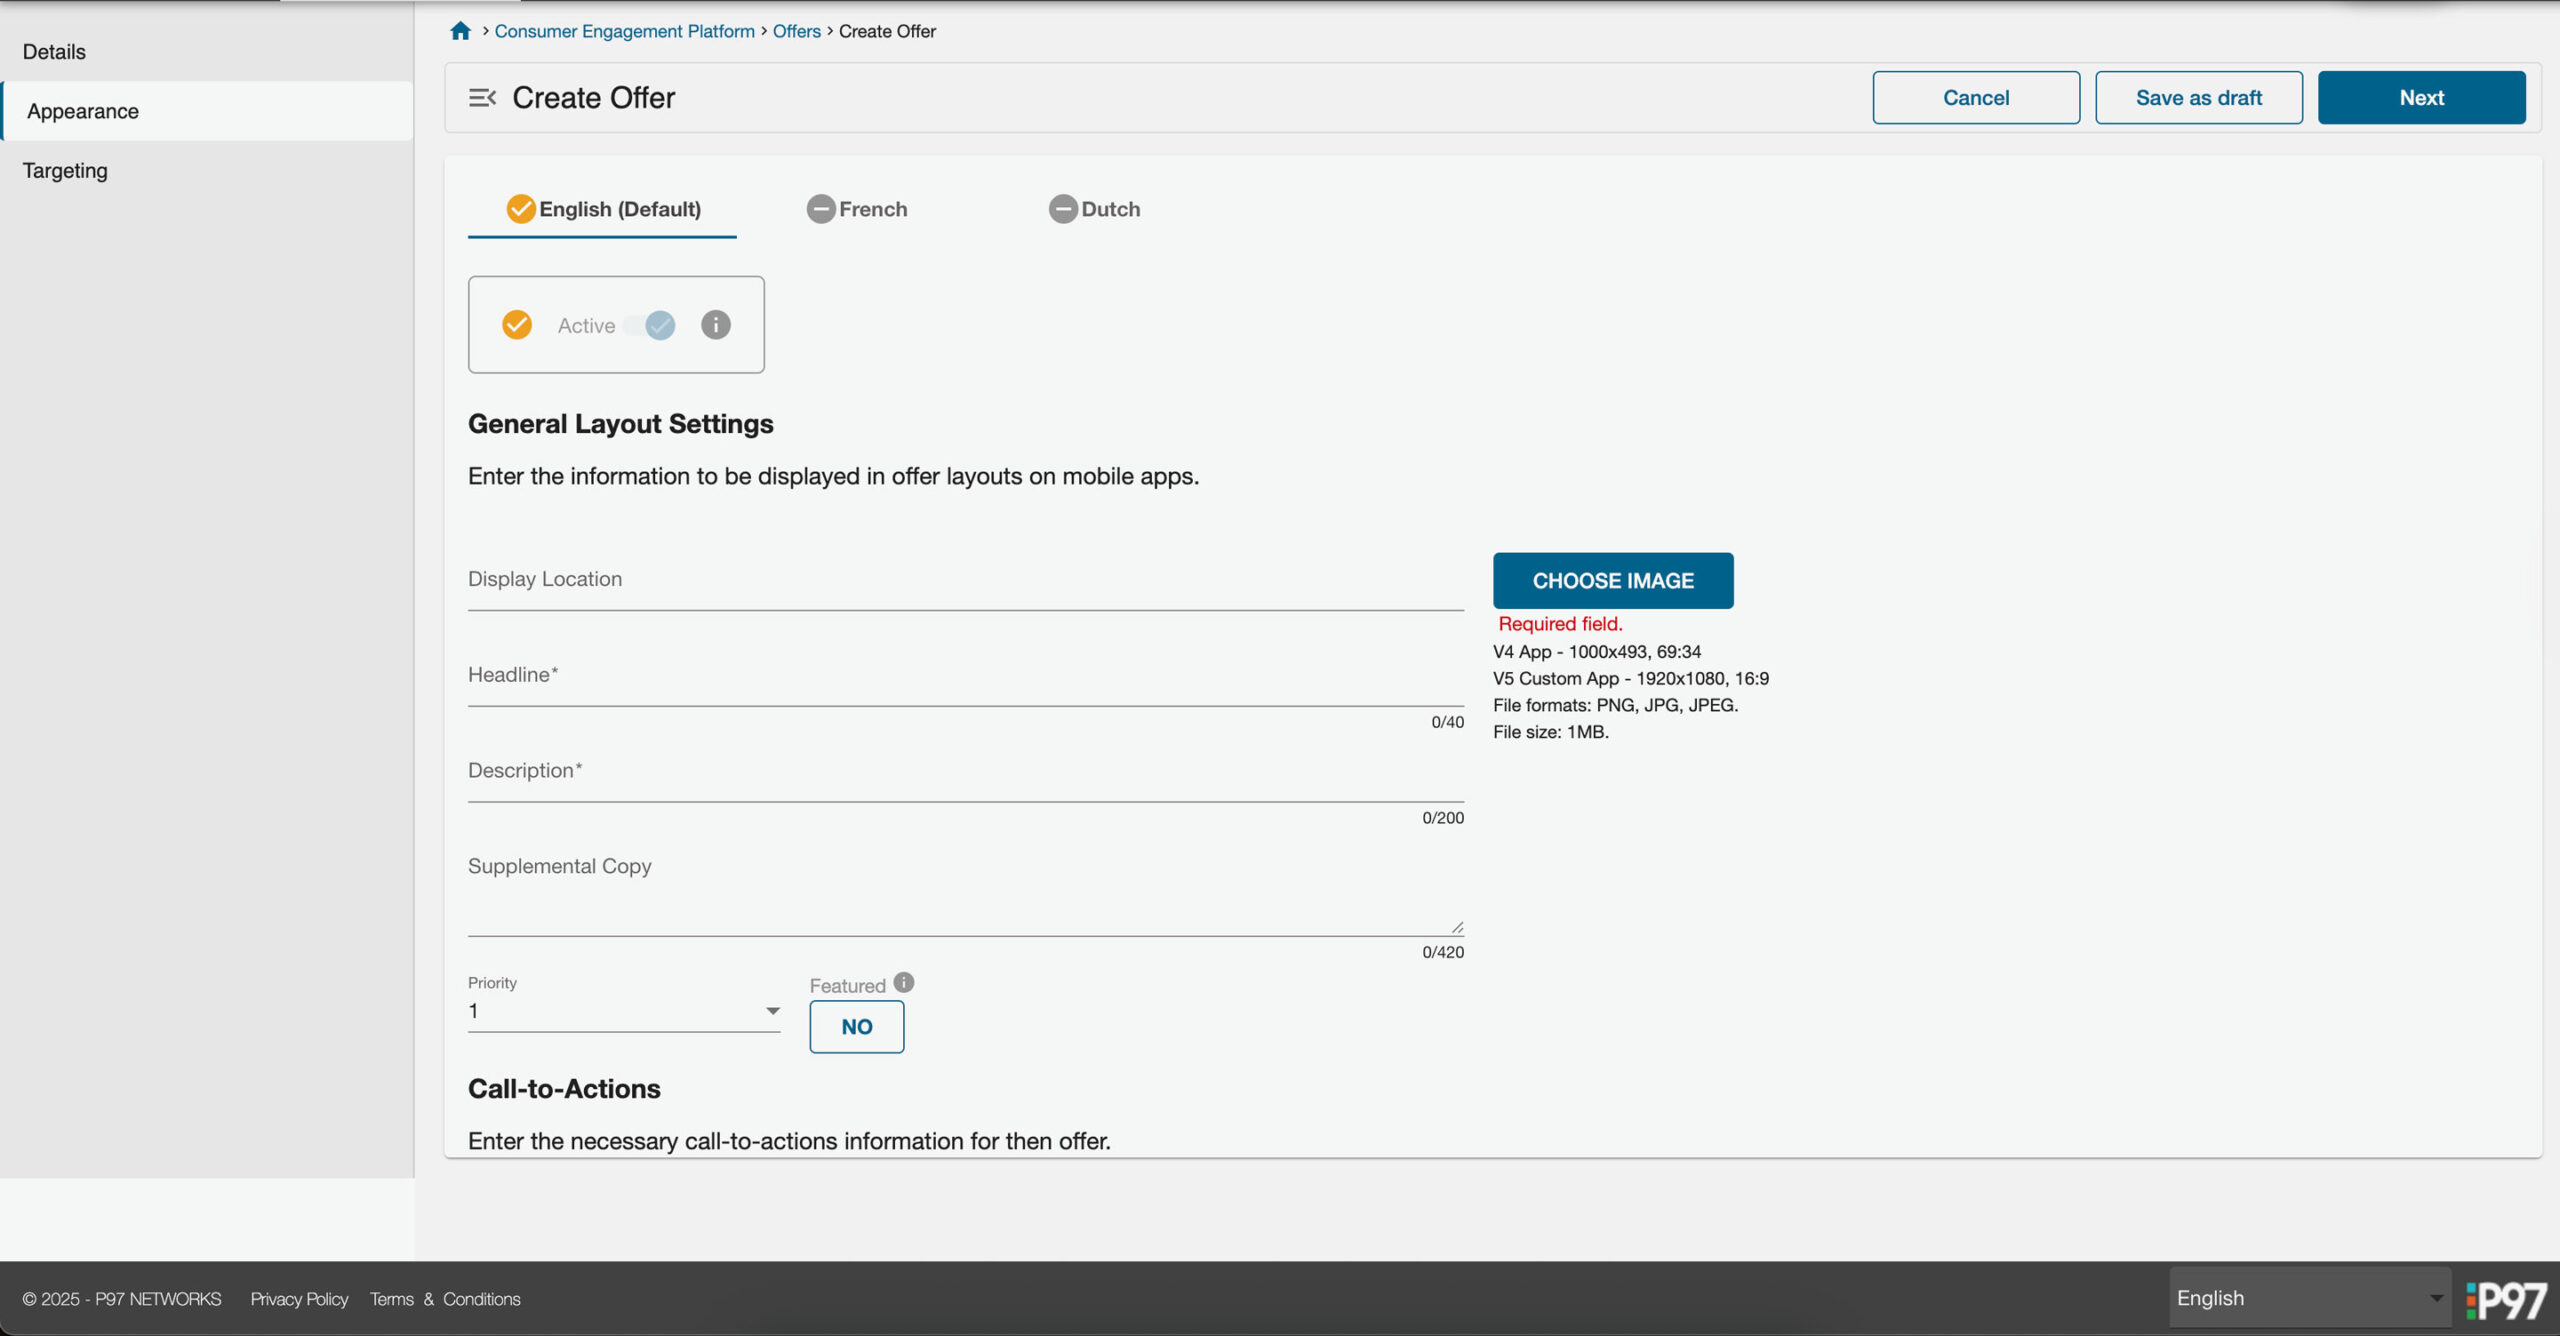
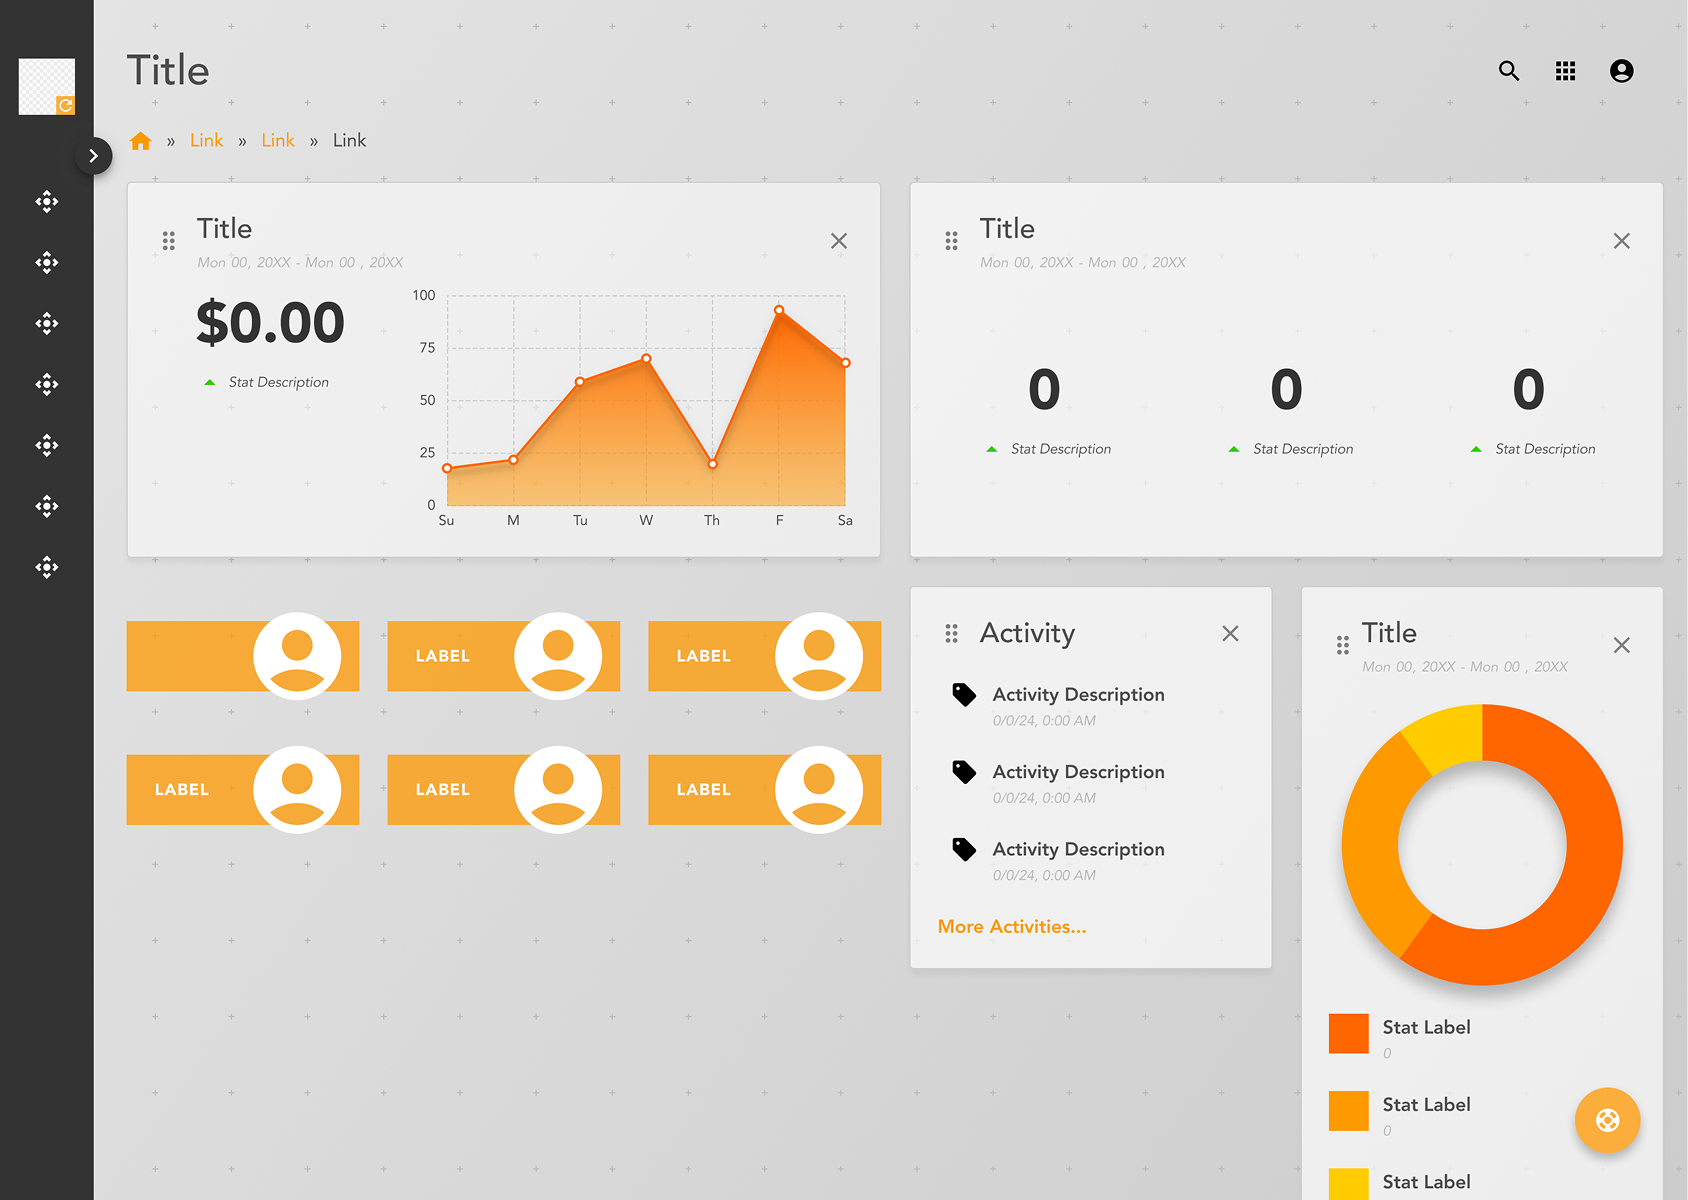
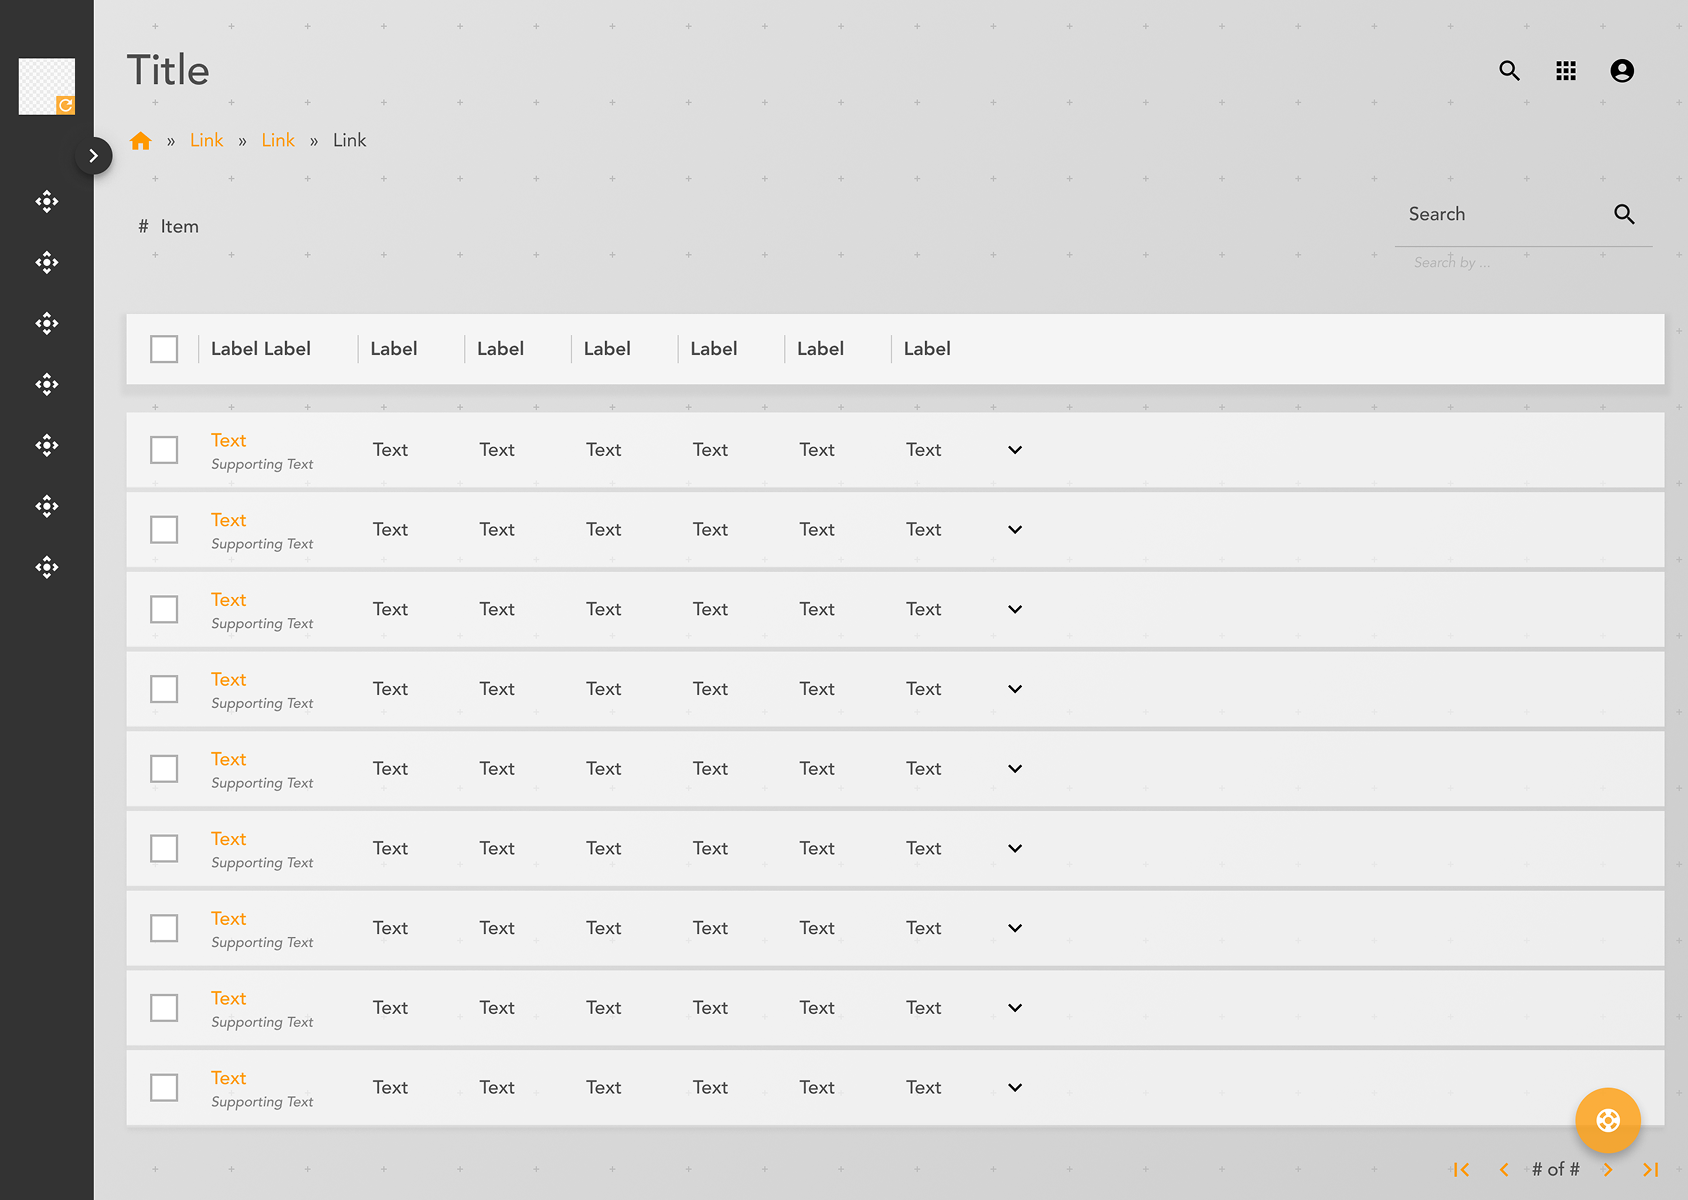
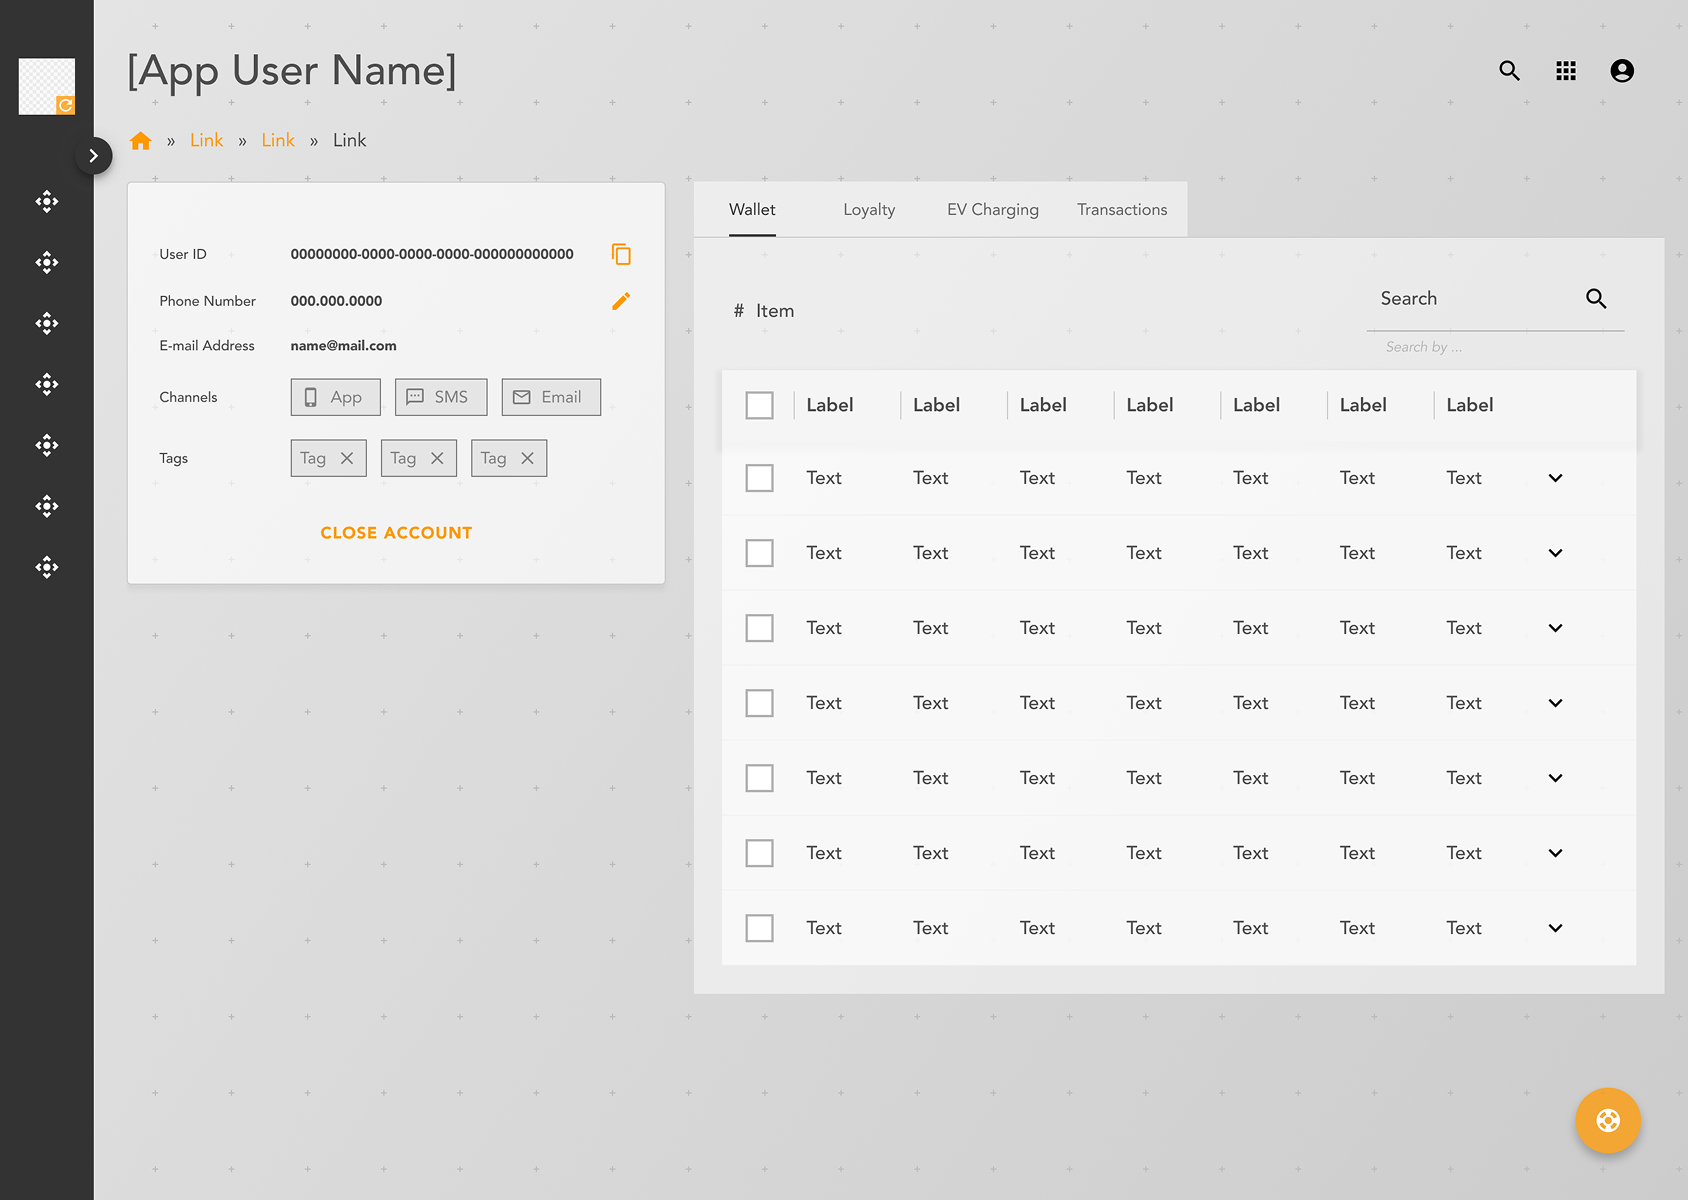
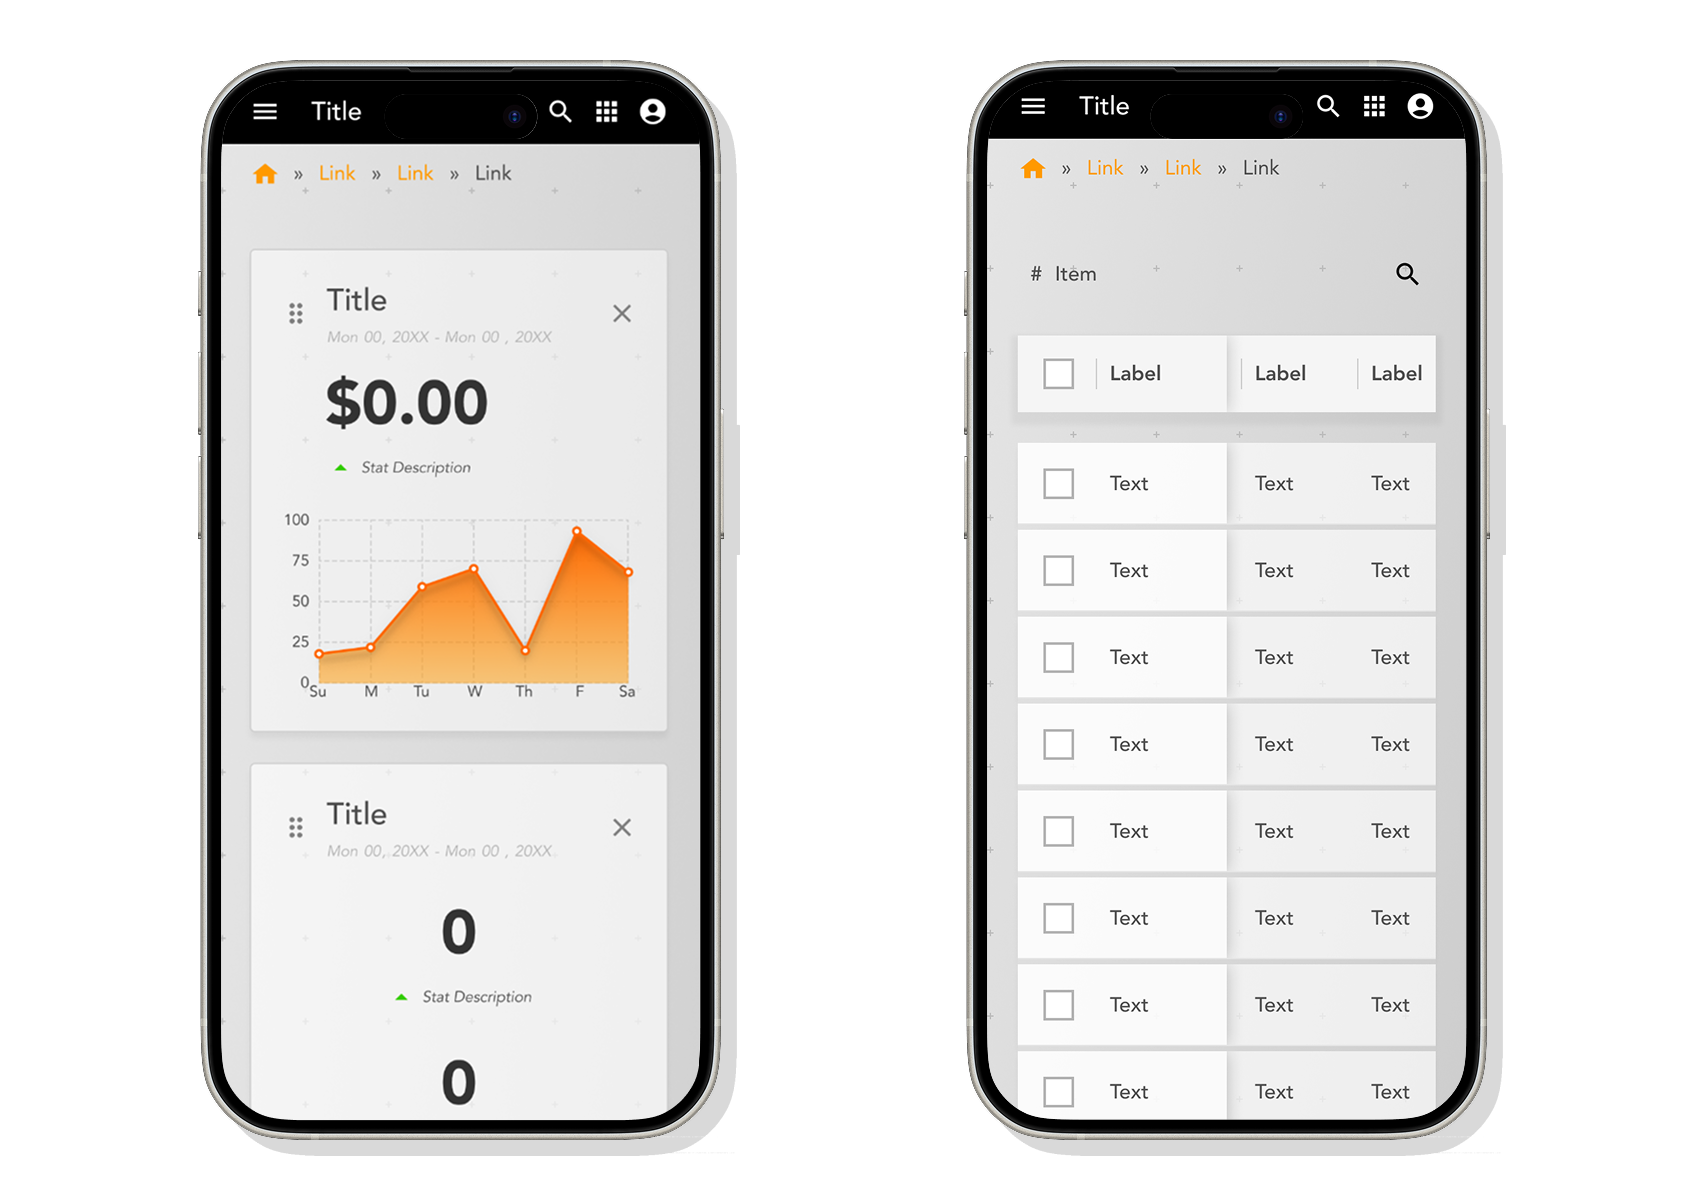
PetroZone is data-heavy, often represented by tables or just numbers – difficult to process.
Scaling Issue
Lack of future proofing of elements and components led to constant patching.
Tasks
As the Senior Product Designer, I helped initiate the task to create a new design system that would be more visually modern and scale for new changes.
Actions
Collaboration
Worked with stakeholders to create a wishlist of new functions
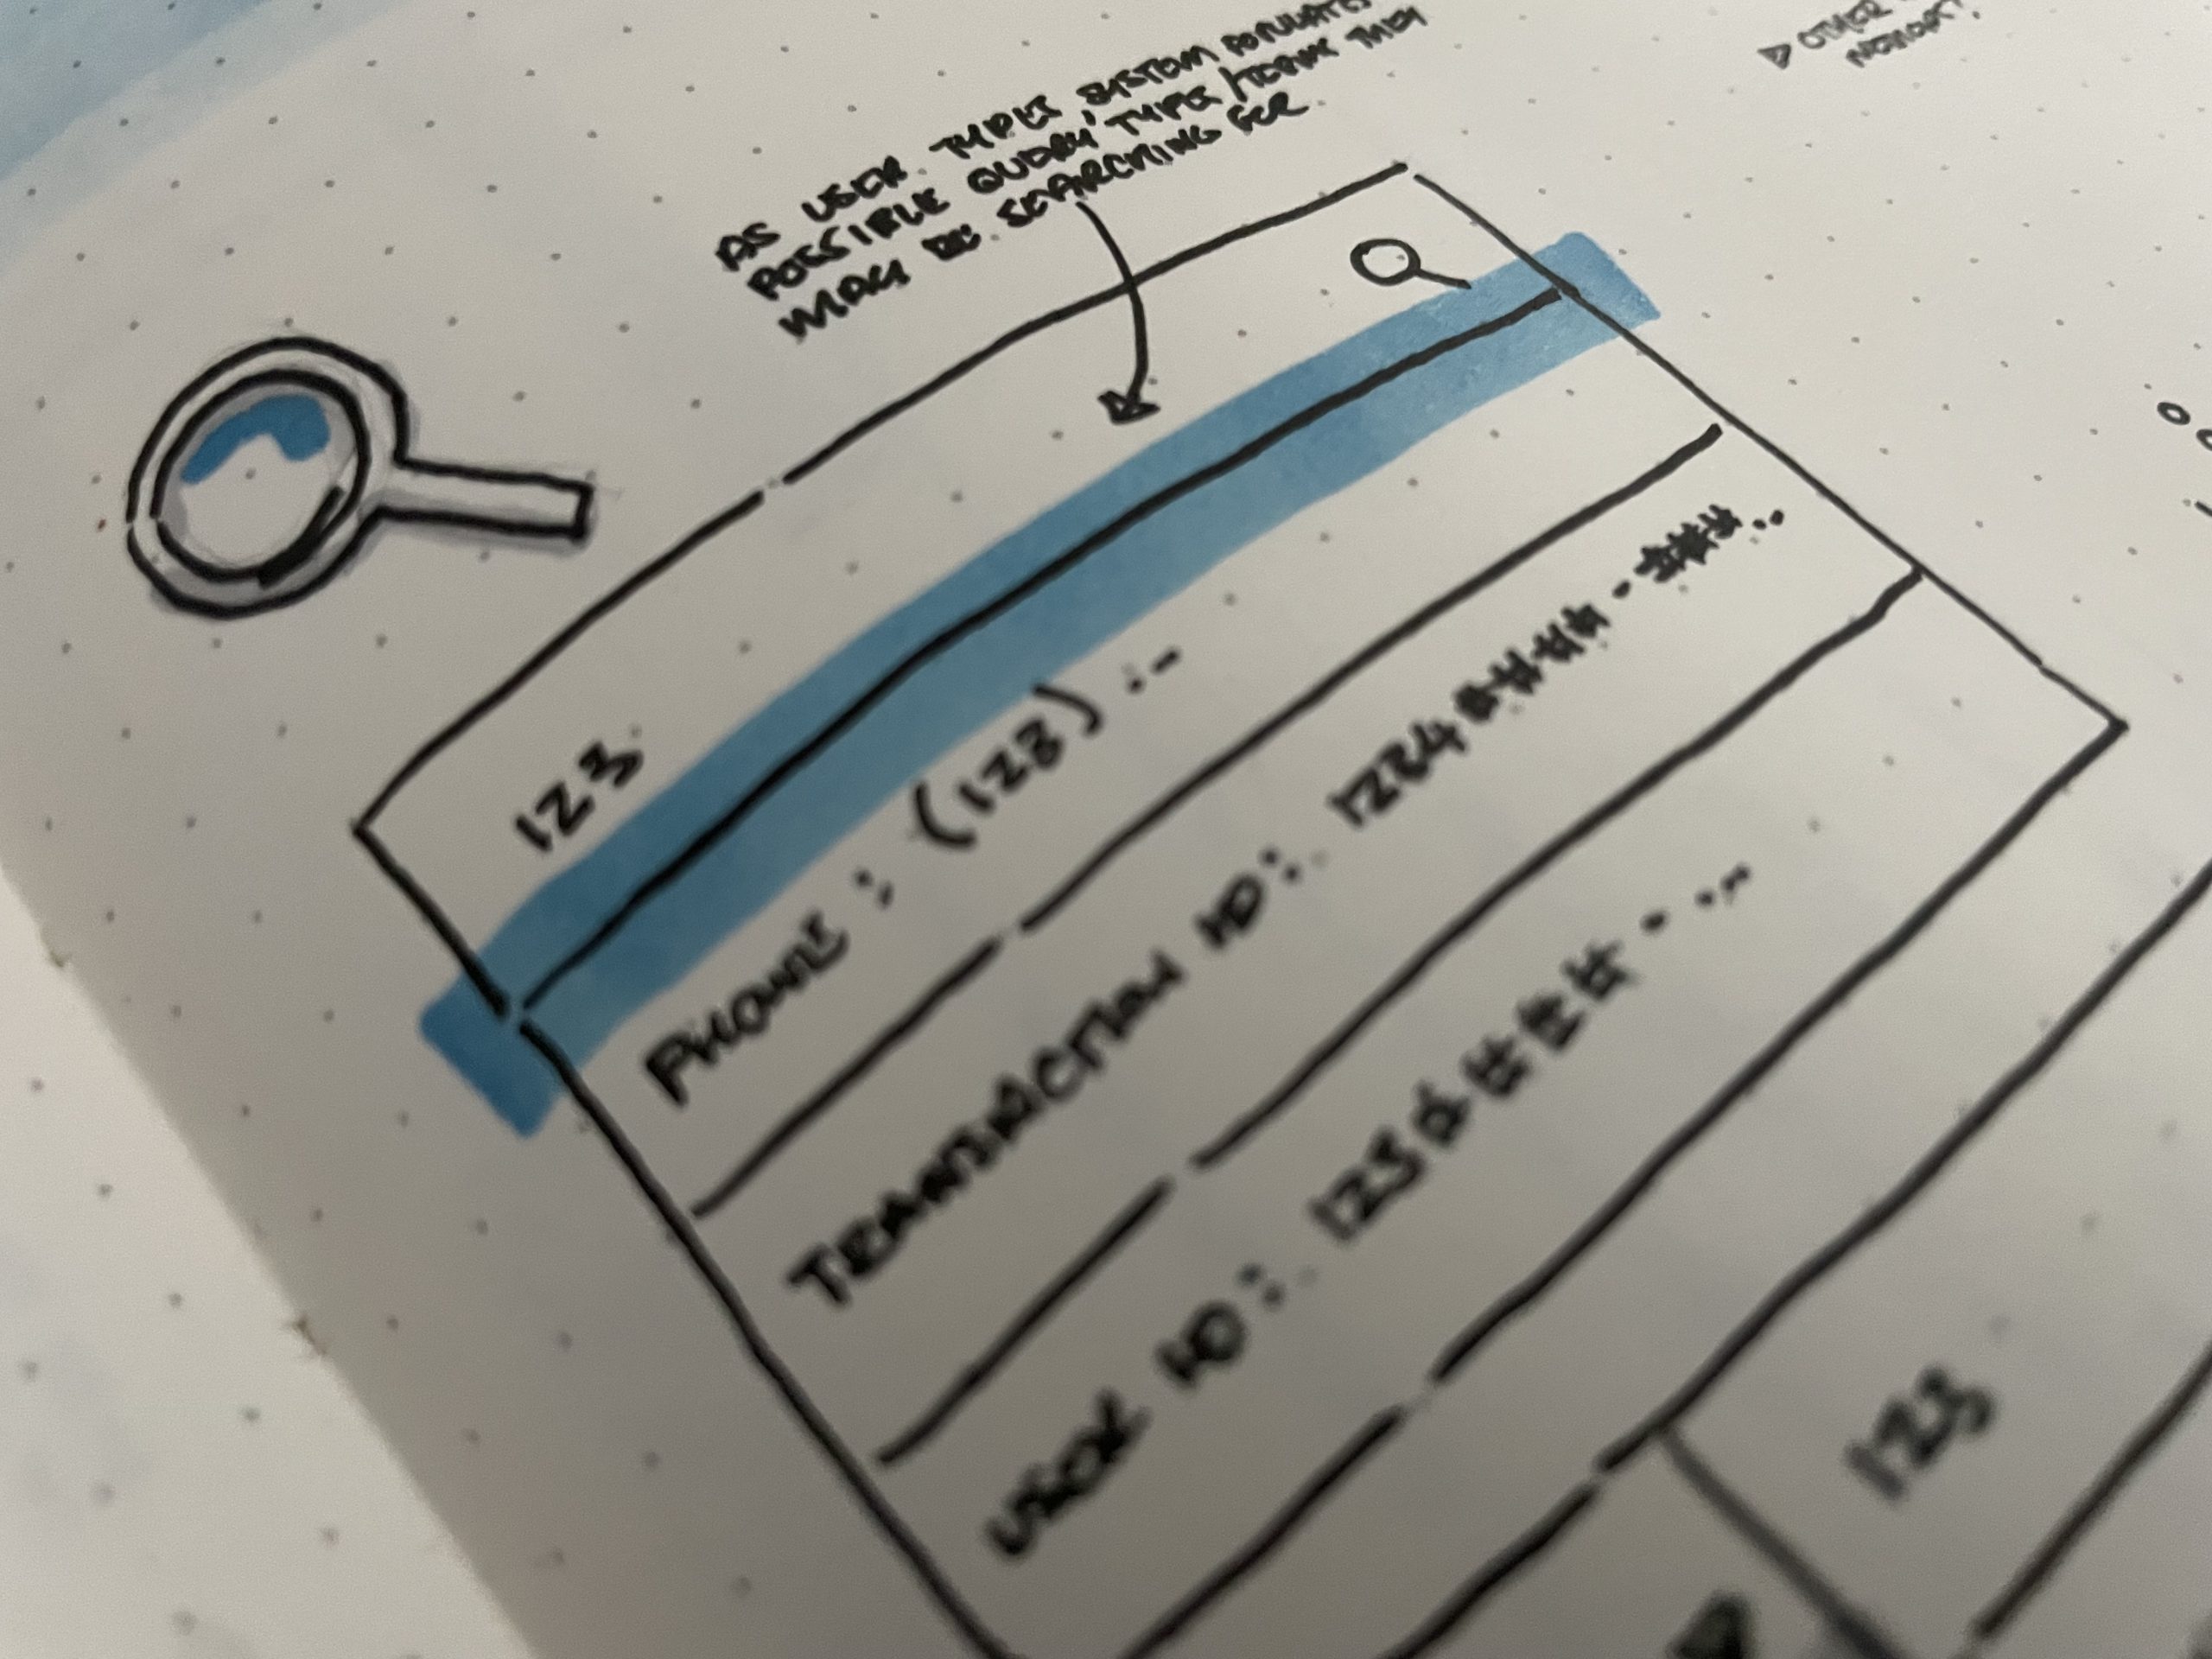
Competitive Analysis
Researched and studied other web portals seeking best practices in patterns and trends.
Inventory
Took inventory of existing elements and components
Material Design
Used Material Library as a base guideline for creating a new library to speed up the design process by 25%. Modified elements and components to fit the new brand
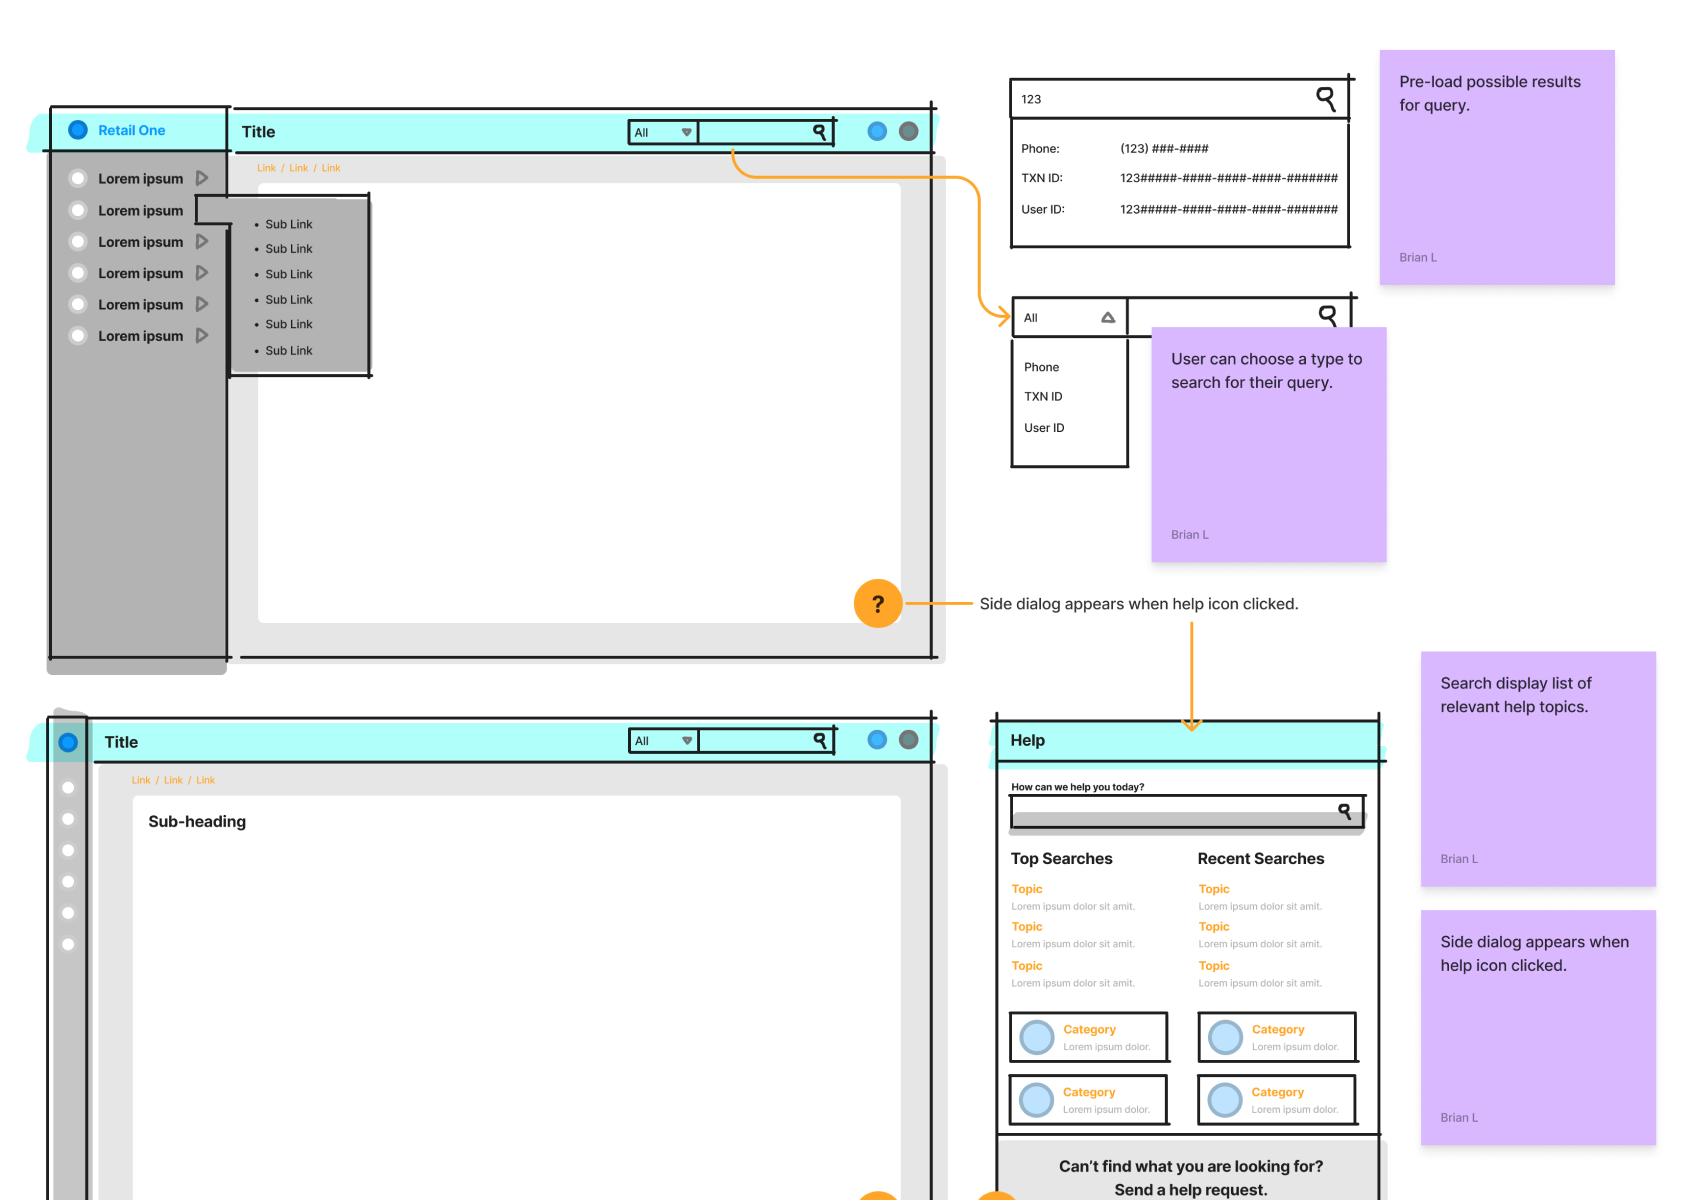
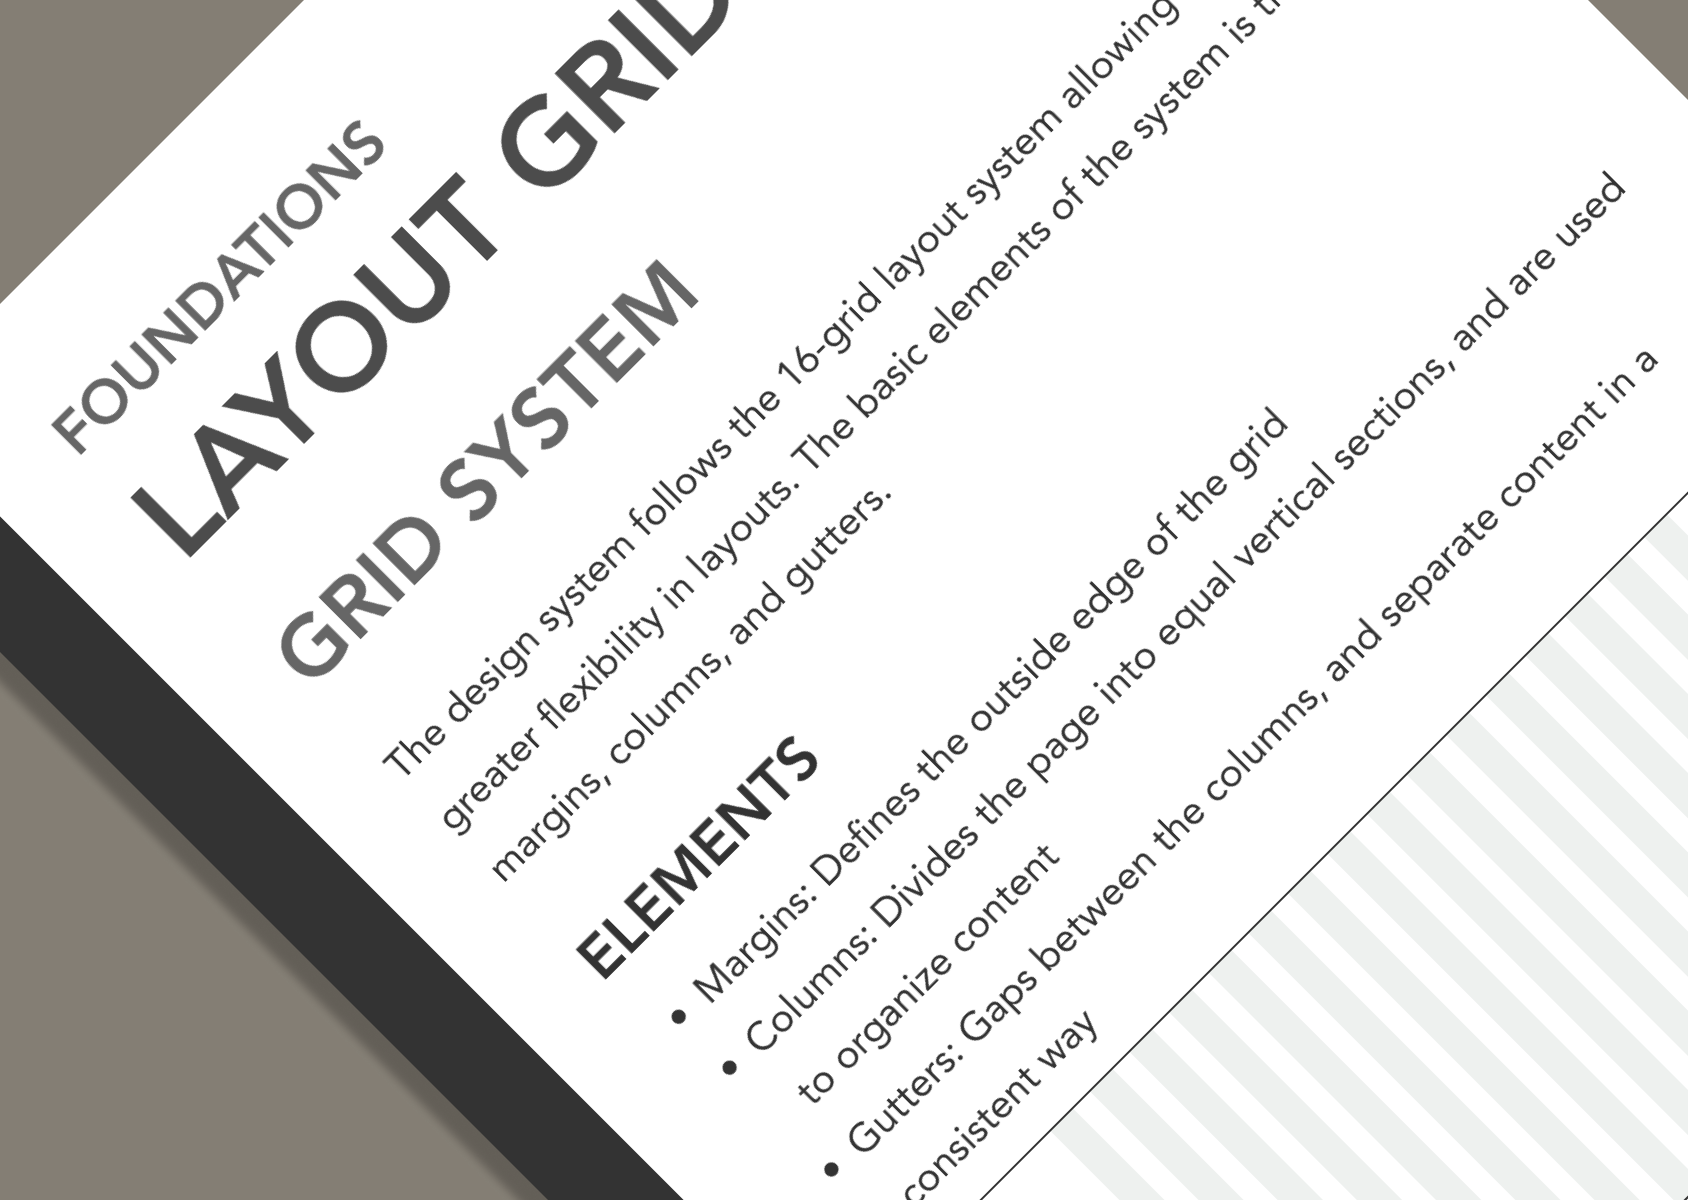
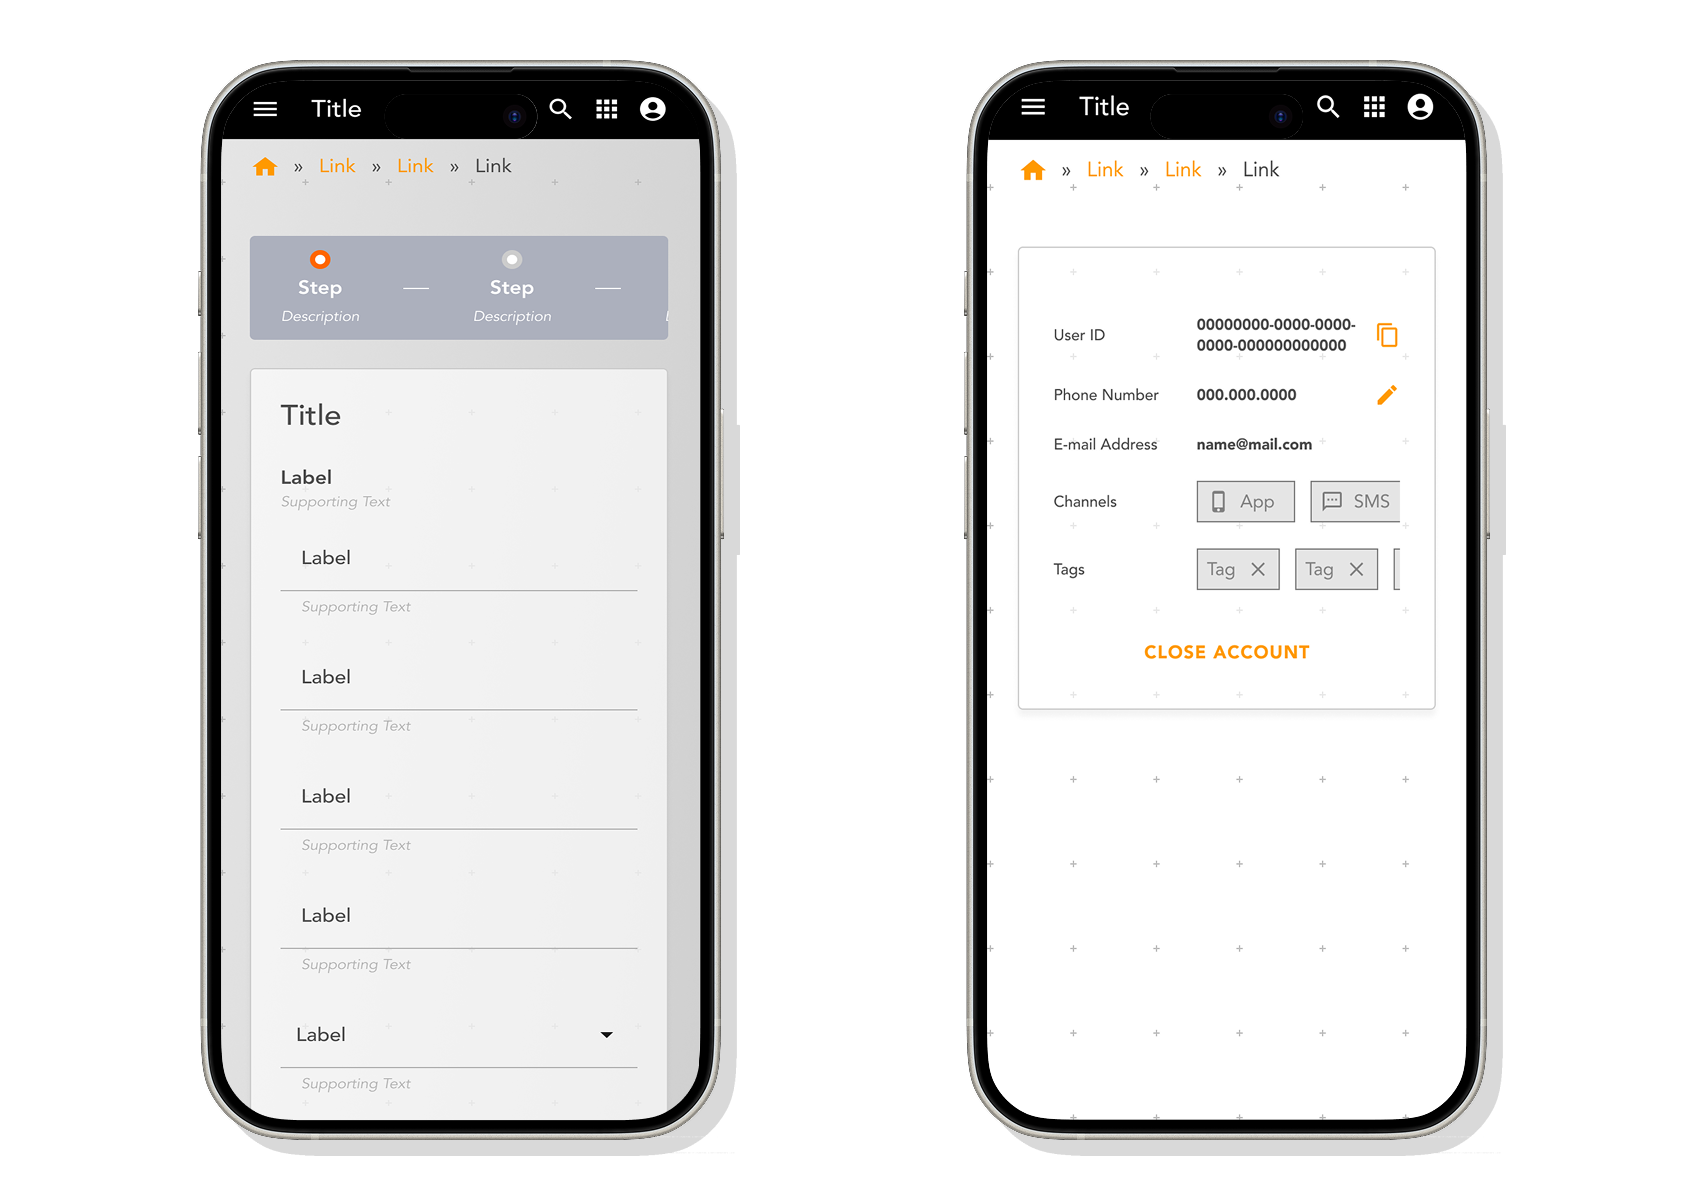
Patterns and Consistency
Focused on UI of patterns and consistency to improve the overall user experience and set standards.
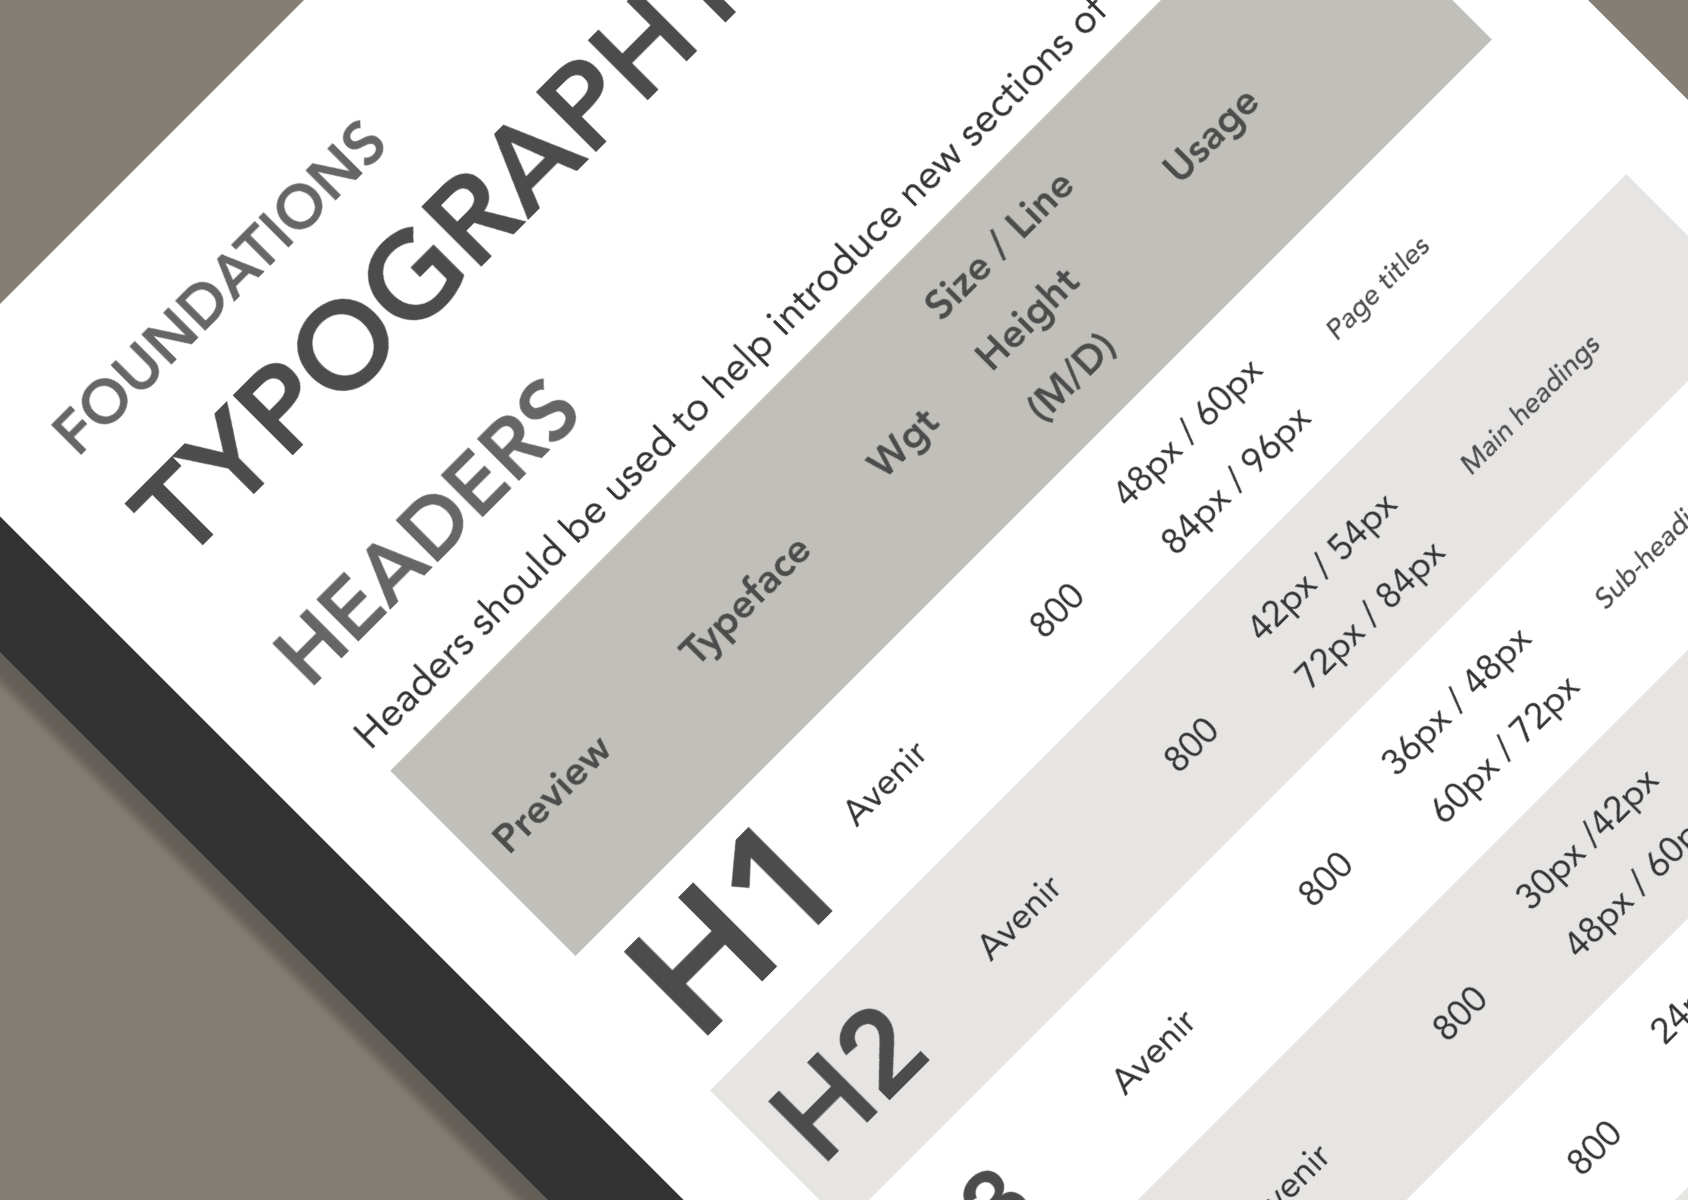
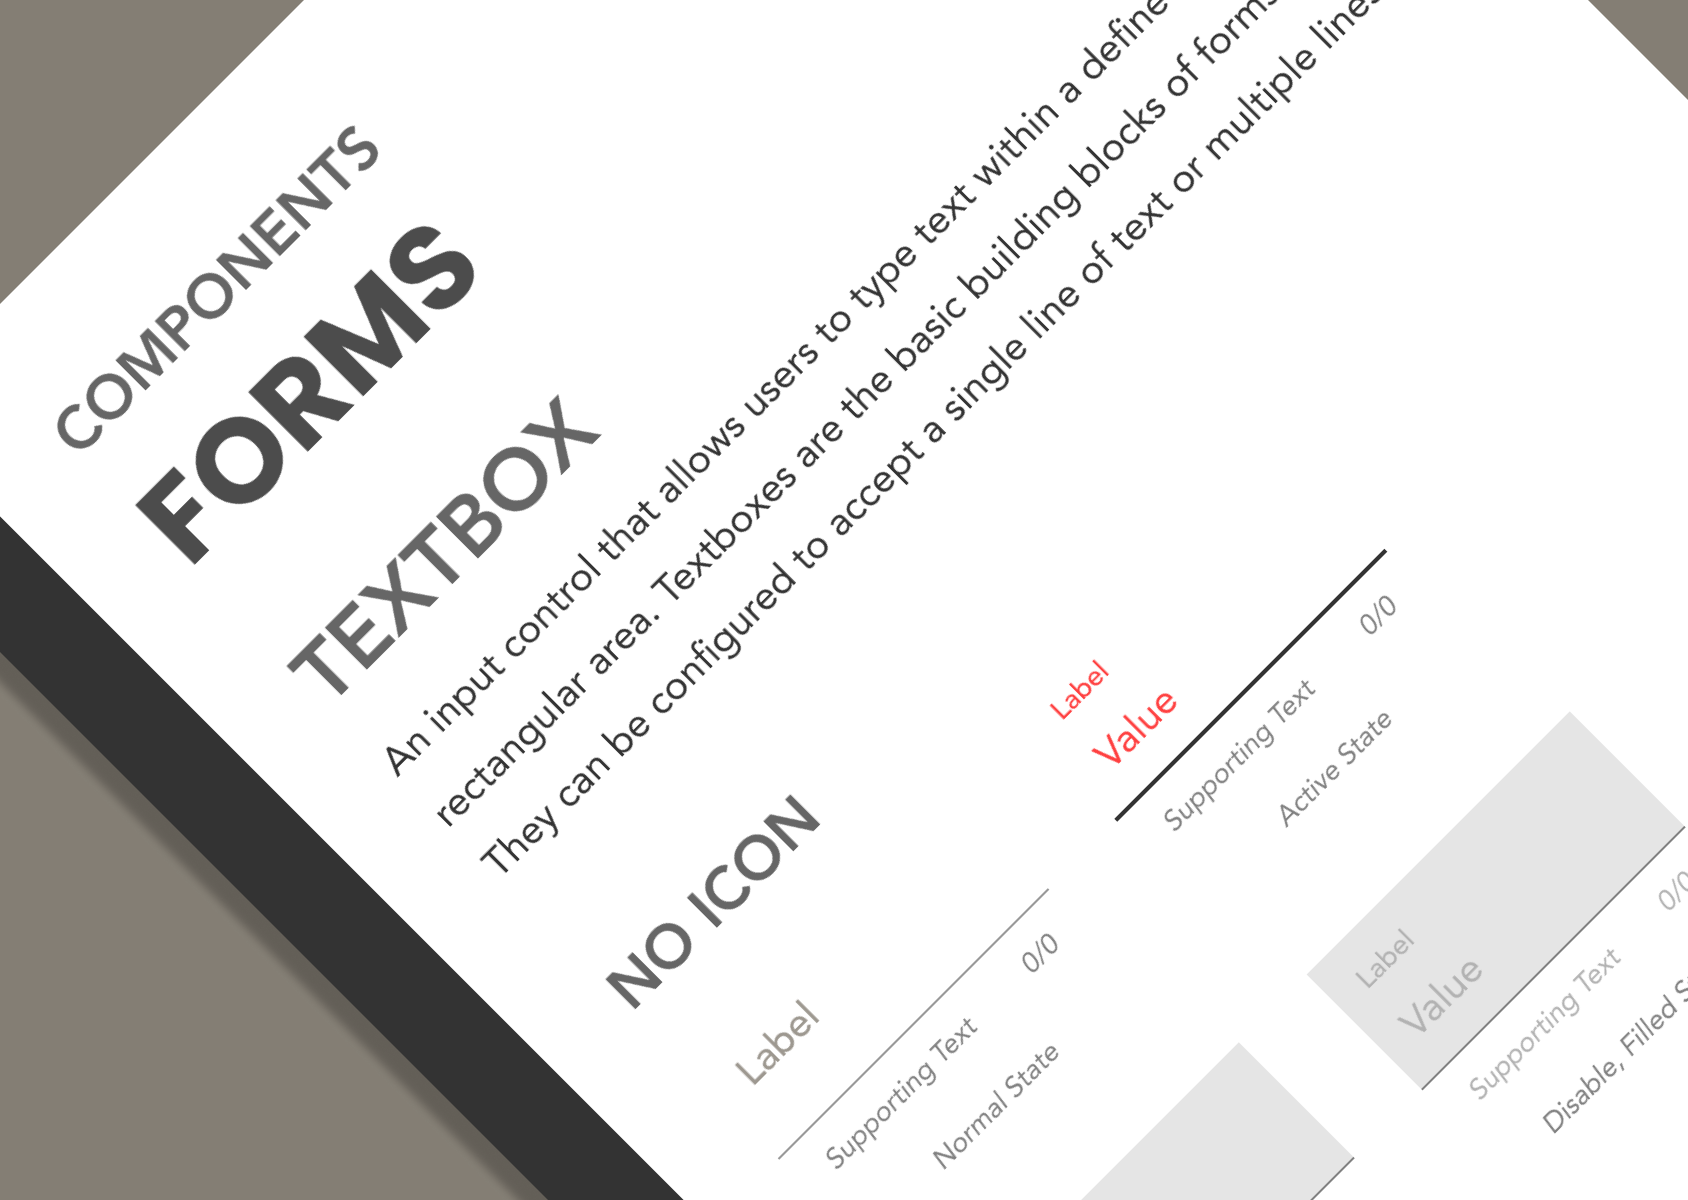
Documentation
Created detailed but flexible descriptions on how and when elements or components are used
Results
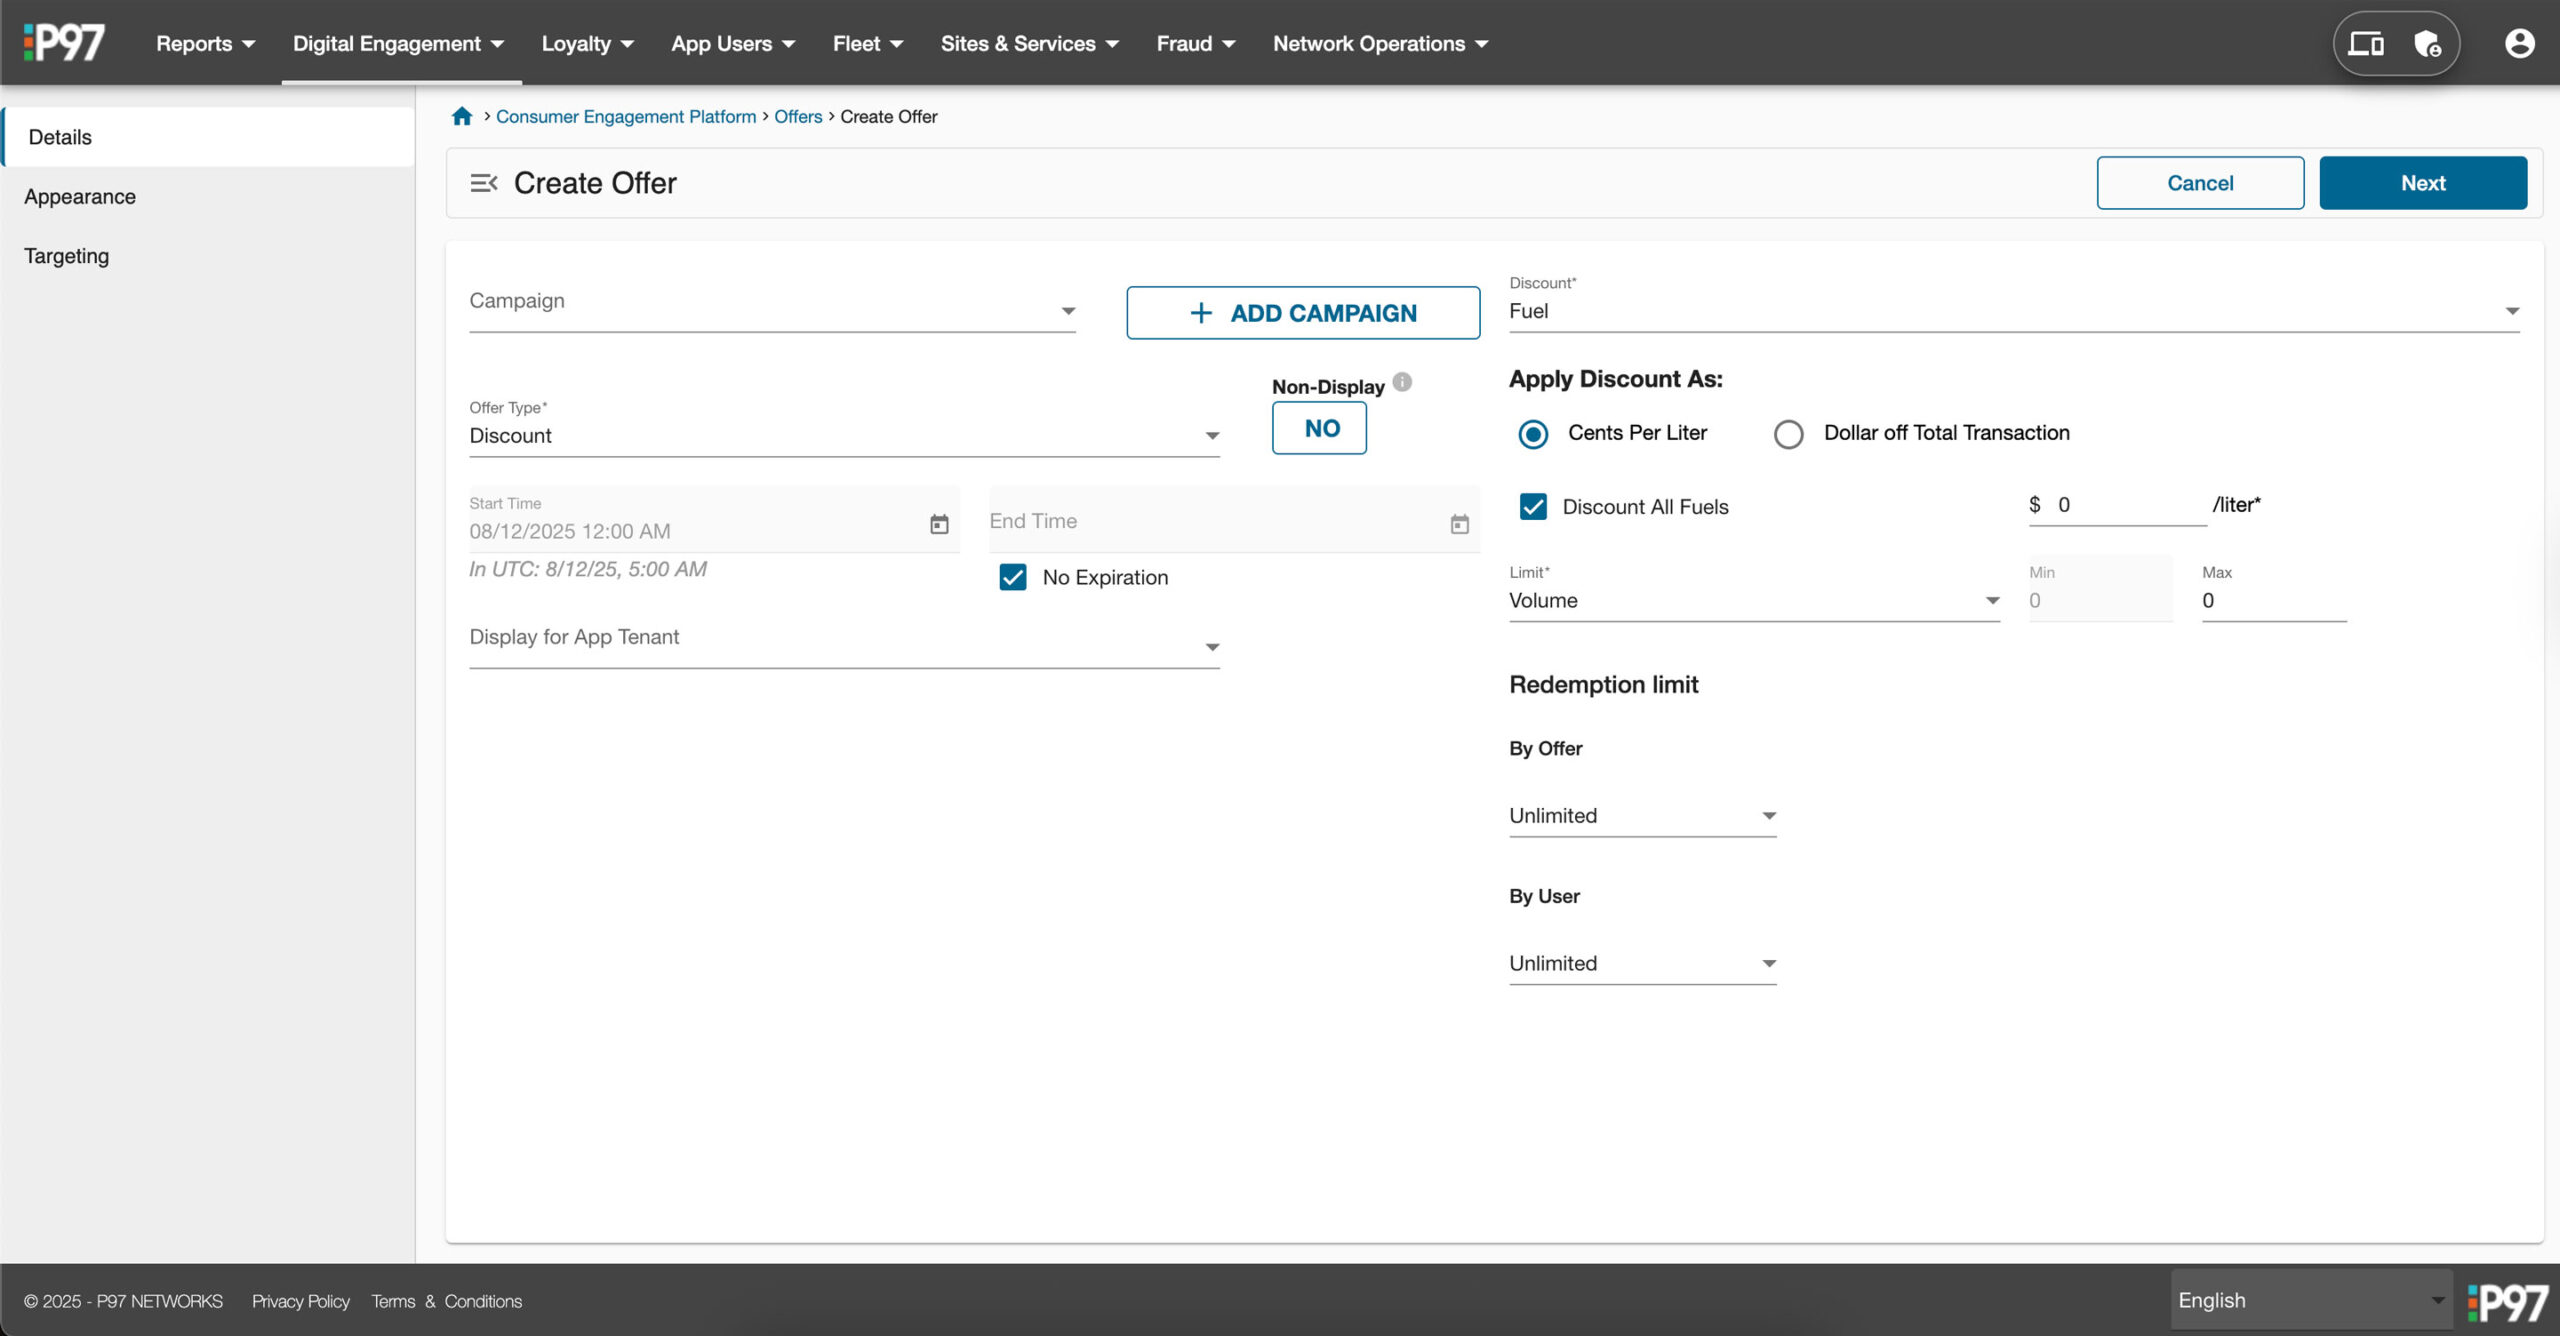
Modern Design
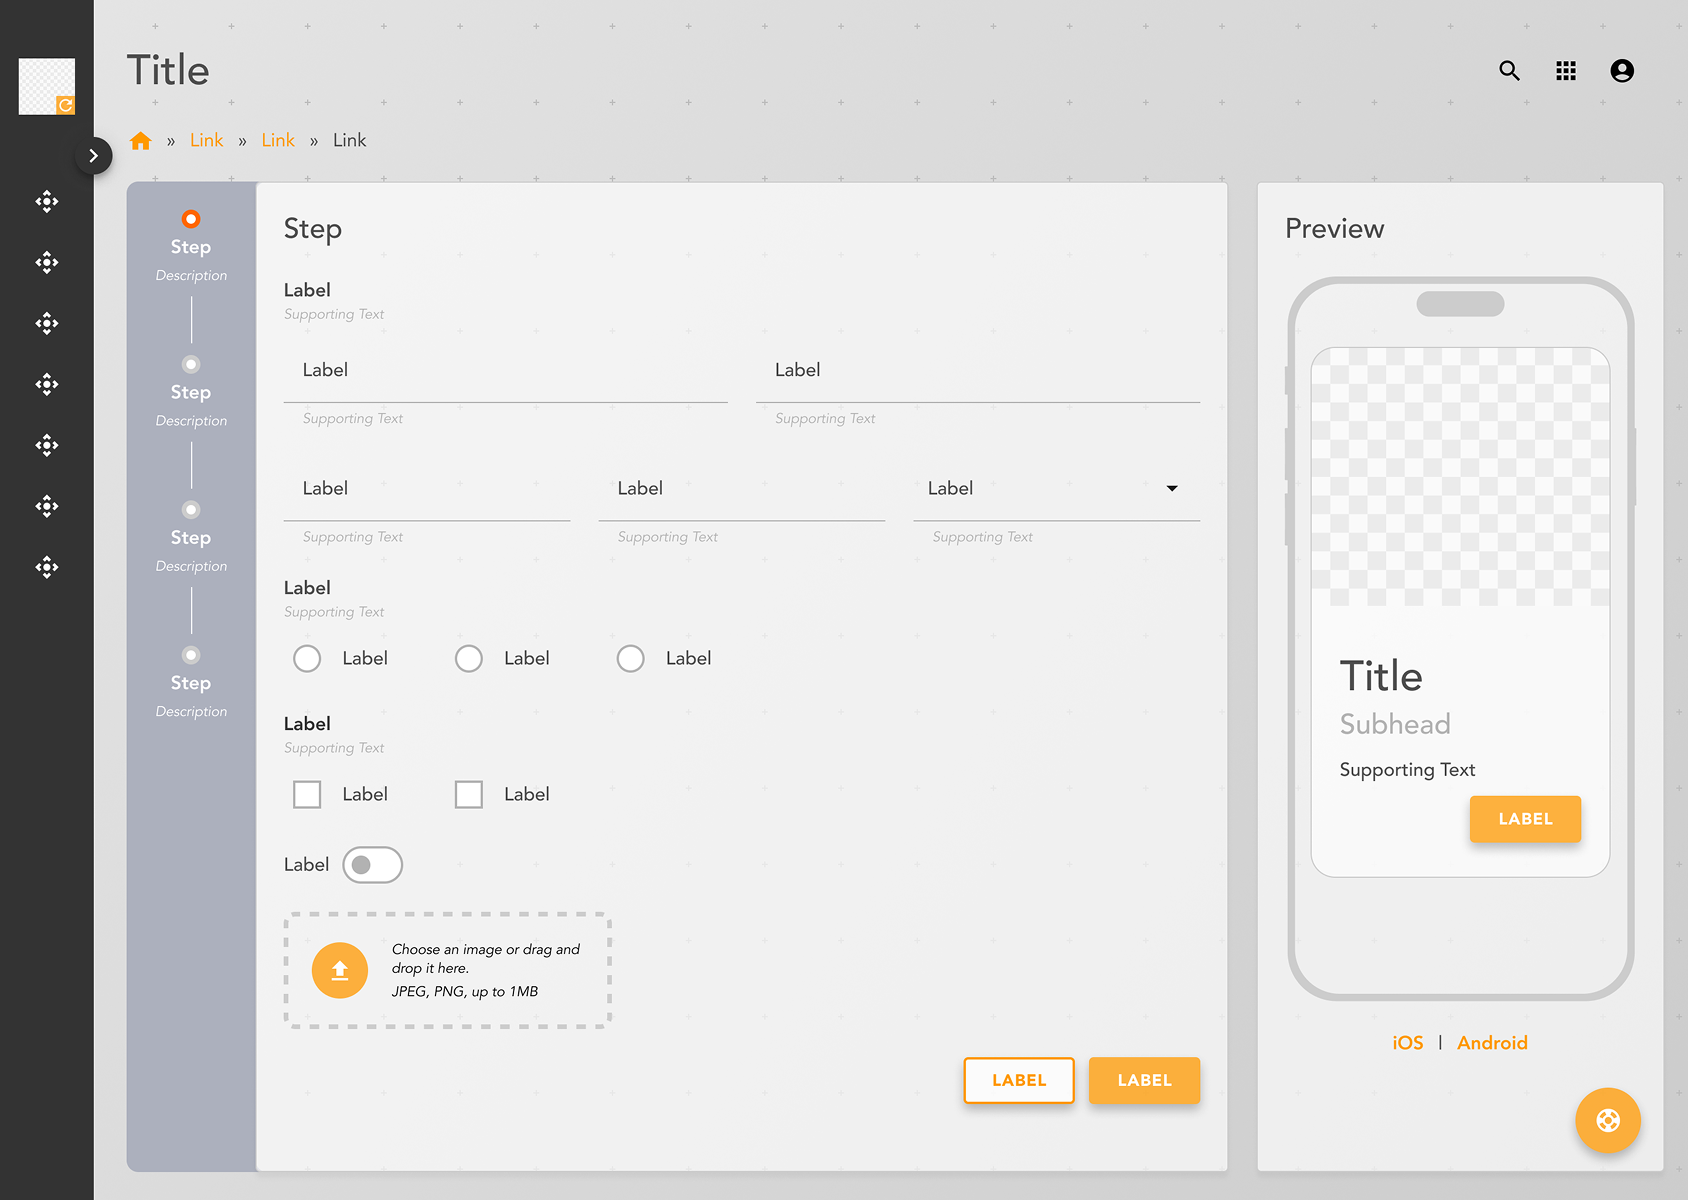
Implemented a design built on Google Material Design to follow modern UI design trends, improving the overall look and feel by 50%.
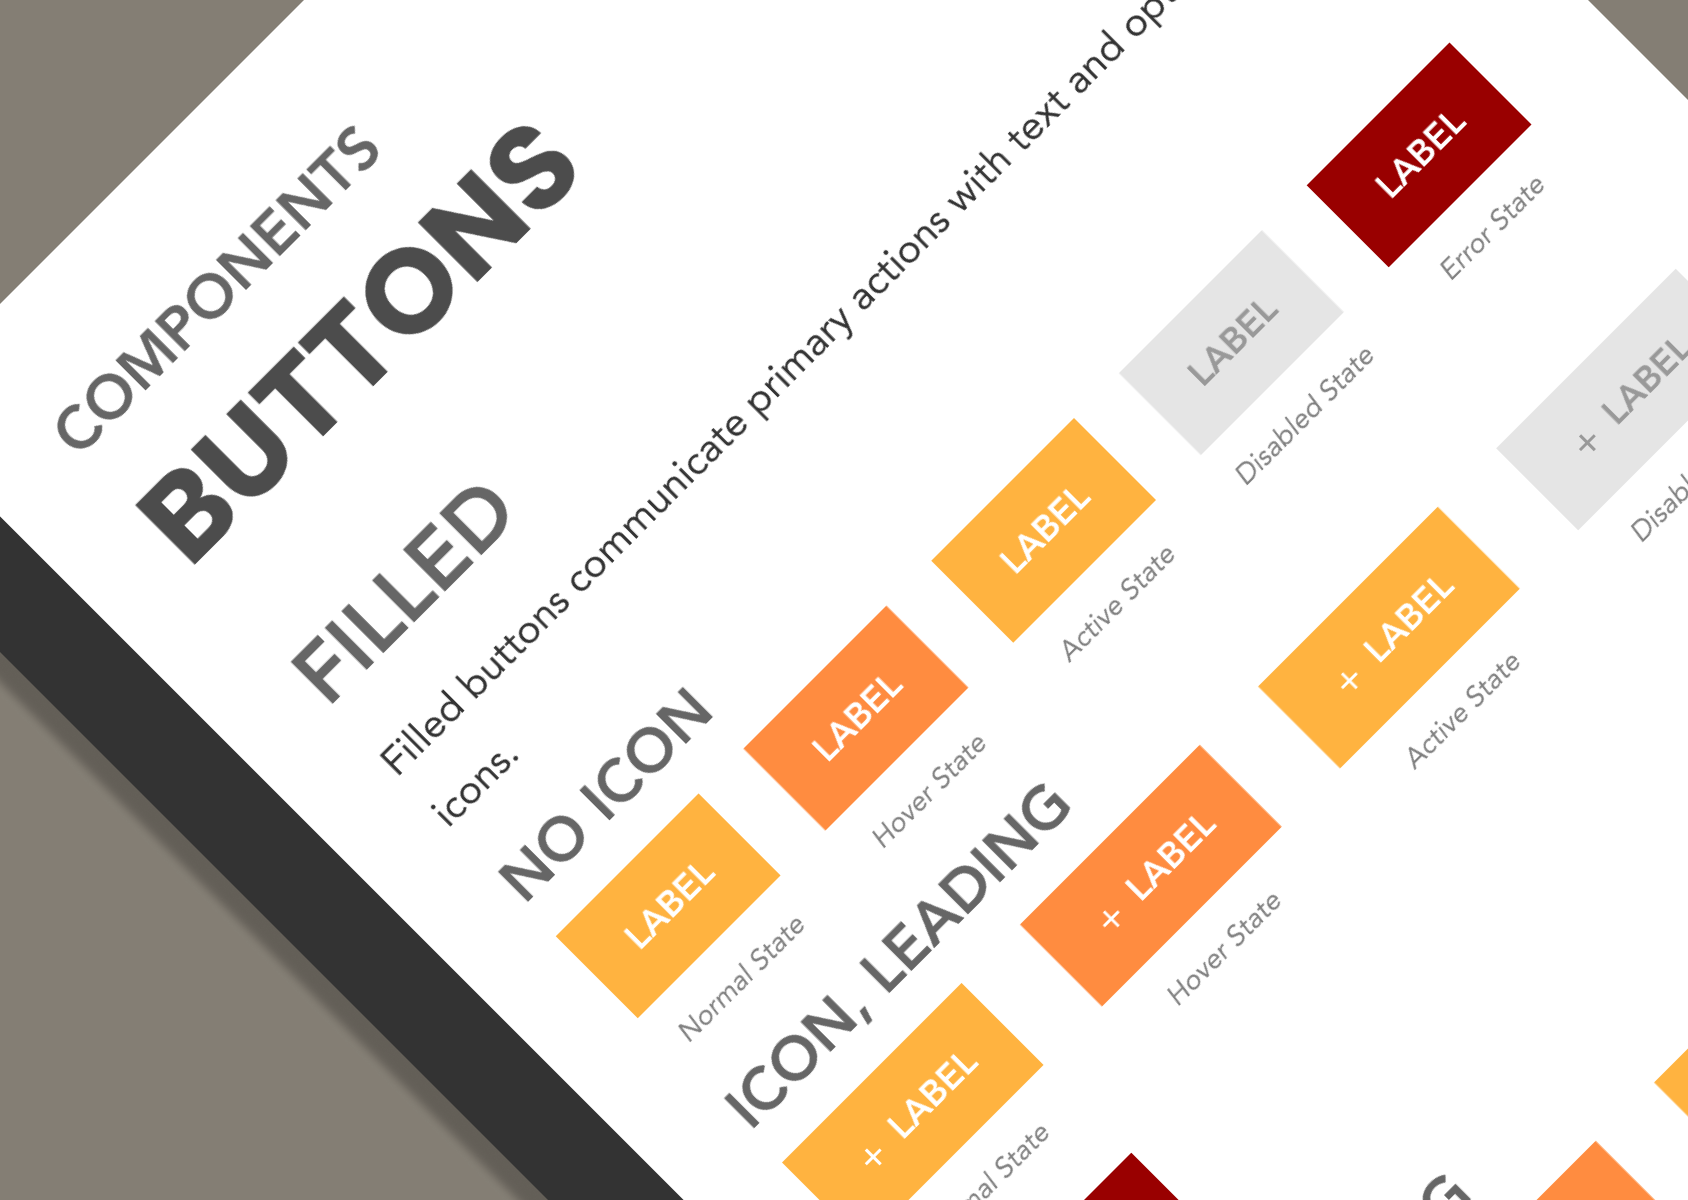
Standardized
Established patterns for UI components for more consistent usage of design, interactions, and language.
Scalability
Elements and components could scale more, reducing the need to create new ones with each change to the web portal.
Visualization
Implemented a variety of graphs to help visualize large amounts of data for easier analysis.

25%
Design Speed
Increased speed of design work.
75%
Improved Consistency
Improved patterns of UI.